Fig. 21.
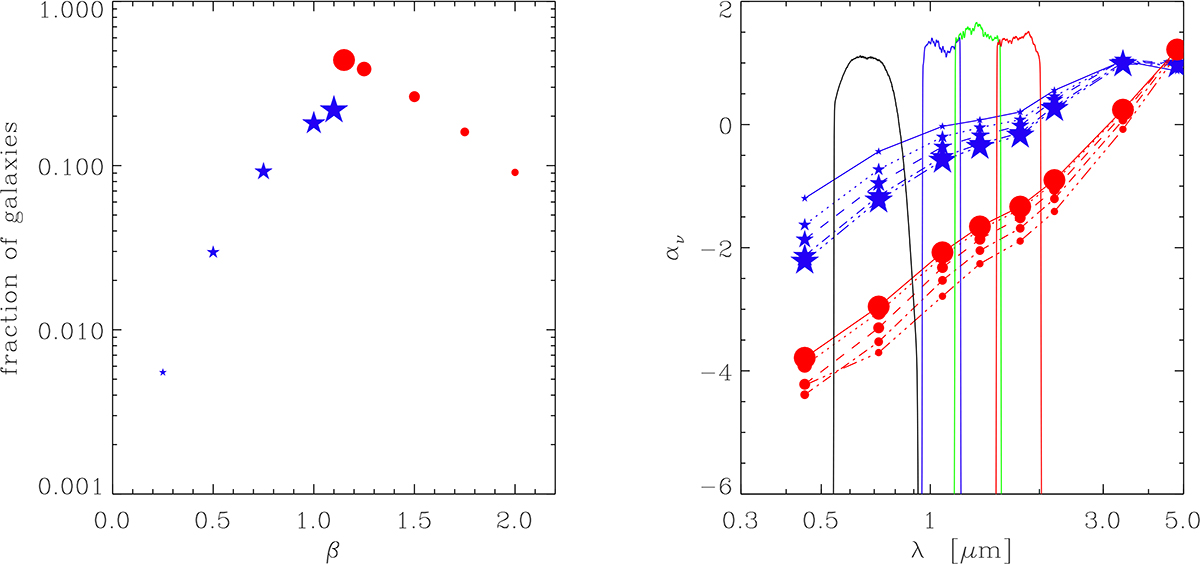
Download original image
Subsample size and spectral index. Blue asterisks mark selection according to Eq. (30), and red circles according to Eq. (31). The left panel shows the fraction of the Flagship catalog galaxies vs. β according to Eqs. (30) and (31). Symbol size increases from (IE, YE), through (YE, JE), to (JE, HE). The right panel shows the resultant αν vs. wavelength for the two subsamples following the notations in the left panel. The panel demonstrates the separability when Eq. (16) is applied at the marked Euclid bands of IE, YE, JE, and HE.
Current usage metrics show cumulative count of Article Views (full-text article views including HTML views, PDF and ePub downloads, according to the available data) and Abstracts Views on Vision4Press platform.
Data correspond to usage on the plateform after 2015. The current usage metrics is available 48-96 hours after online publication and is updated daily on week days.
Initial download of the metrics may take a while.