Fig. 2.
Download original image
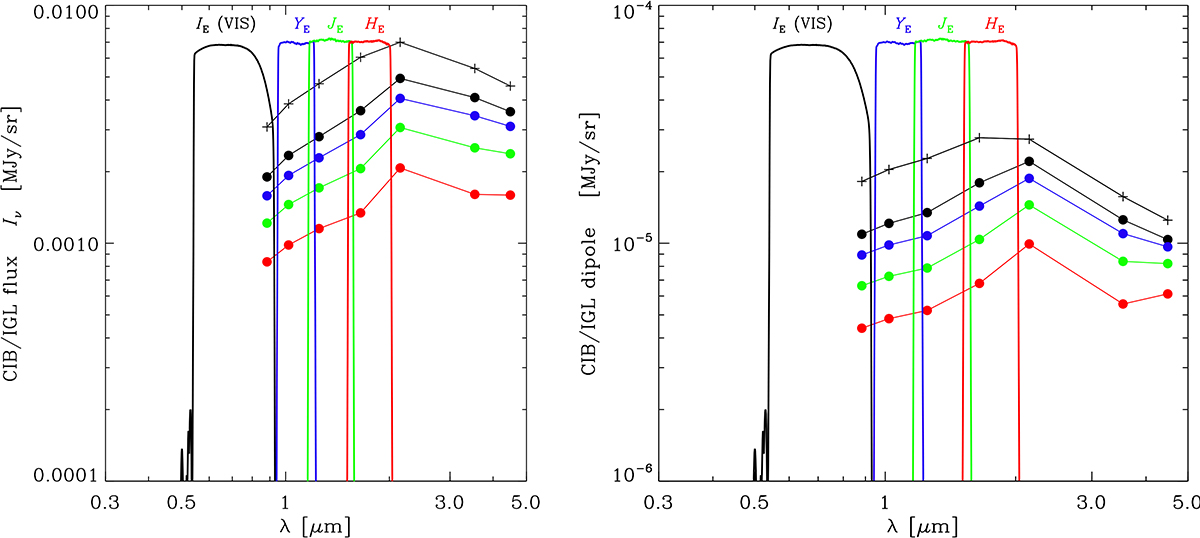
Expected IGL amplitudes. Left: The mean IGL flux. Right: The IGL dipole per Eqs. (2) and (3) and assuming V = 370 km s−1. Black plus signs correspond to the entire range of magnitudes. Black, blue, green, and red circles correspond to IGL from galaxies between m1 = 25 and m0 = 18, 19, 20, 21. The IGL is integrated over the JWST latest counts (Windhorst et al. 2023) at the marked central wavelengths. The four Euclid filters are shown per Euclid Collaboration (2022a).
Current usage metrics show cumulative count of Article Views (full-text article views including HTML views, PDF and ePub downloads, according to the available data) and Abstracts Views on Vision4Press platform.
Data correspond to usage on the plateform after 2015. The current usage metrics is available 48-96 hours after online publication and is updated daily on week days.
Initial download of the metrics may take a while.