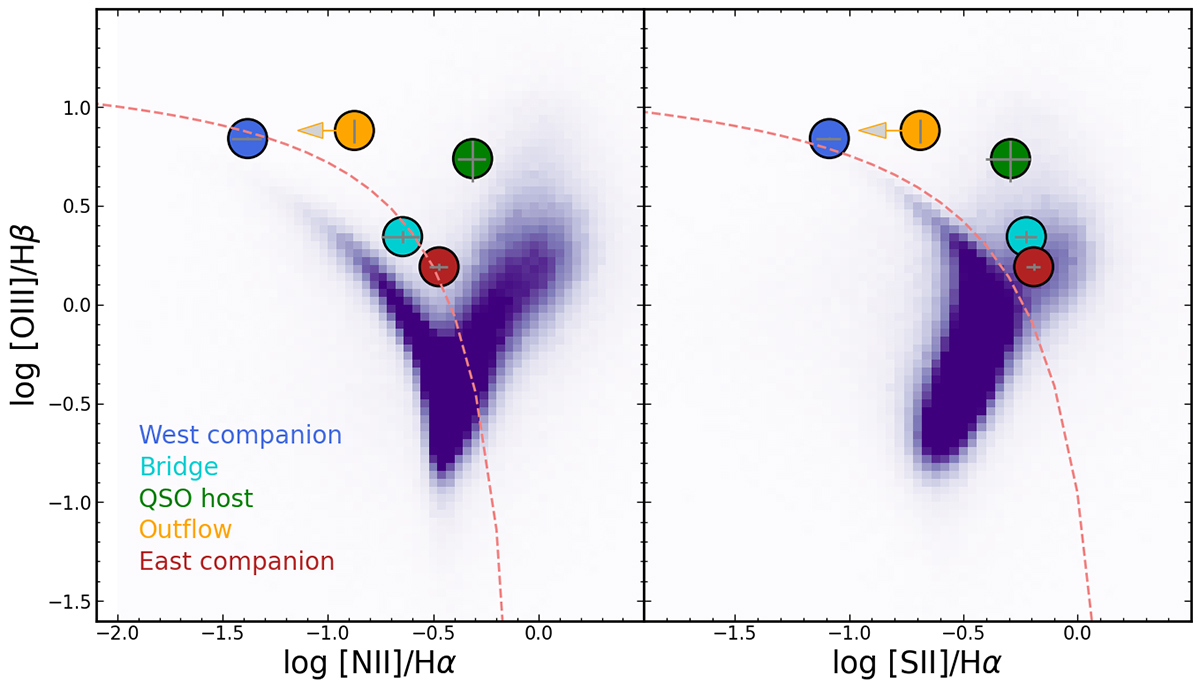
Fig. 6.
Download original image
Location of the various regions in the PJ308–21 system in the BPT diagram. The observed line ratios (and their limits) are plotted against the SDSS galaxy sample (purple shades) and the empirical thresholds between star-forming galaxies and AGN hosts (dashed lines, adopted from Kewley et al. 2006). Throughout the system, the high [O III]/Hβ line ratios suggest harder ionization conditions than the typical SDSS galaxy at low redshift.
Current usage metrics show cumulative count of Article Views (full-text article views including HTML views, PDF and ePub downloads, according to the available data) and Abstracts Views on Vision4Press platform.
Data correspond to usage on the plateform after 2015. The current usage metrics is available 48-96 hours after online publication and is updated daily on week days.
Initial download of the metrics may take a while.