Fig. 7
Download original image
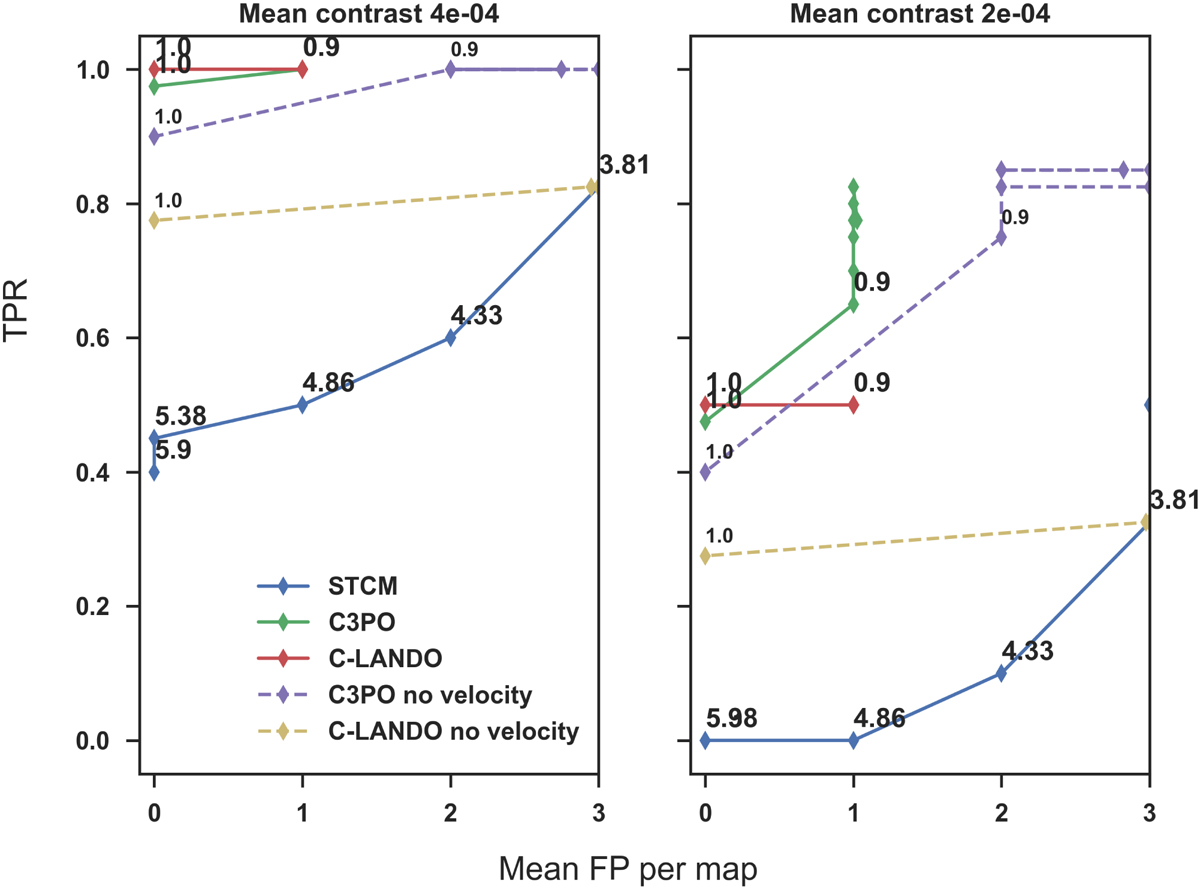
Comparison of mROC curves produced with and without using the velocity dimension, using otherwise the same dataset, at two contrast levels (4 × 10⁻⁴ and 2 × 10⁻⁴) and for a separation of 3–4 FWHM. In the cases where the velocity dimension is not used, illustrated with the purple and yellow dashed lines for C3PO and C-LANDO, respectively, the velocity dimension is replaced by the central velocity bin. This makes the comparison to STCM a little more balanced as STCM does not have the capability to use the velocity dimension. A final noteworthy point is that given the data dimensionality used by both the ML algorithms and STCM, it is truly fair to compare the solid blue line in Fig. 7 and the dashed lines produced by the ML algorithms, and we note the TPRs produced by the ML algorithms are higher; however, the FPs produced by C-LANDO are similar, when reducing the threshold, to those produced by STCM (FP = 3). We note that the solid curves remain the same as in Fig. 5.
Current usage metrics show cumulative count of Article Views (full-text article views including HTML views, PDF and ePub downloads, according to the available data) and Abstracts Views on Vision4Press platform.
Data correspond to usage on the plateform after 2015. The current usage metrics is available 48-96 hours after online publication and is updated daily on week days.
Initial download of the metrics may take a while.