Fig. 5
Download original image
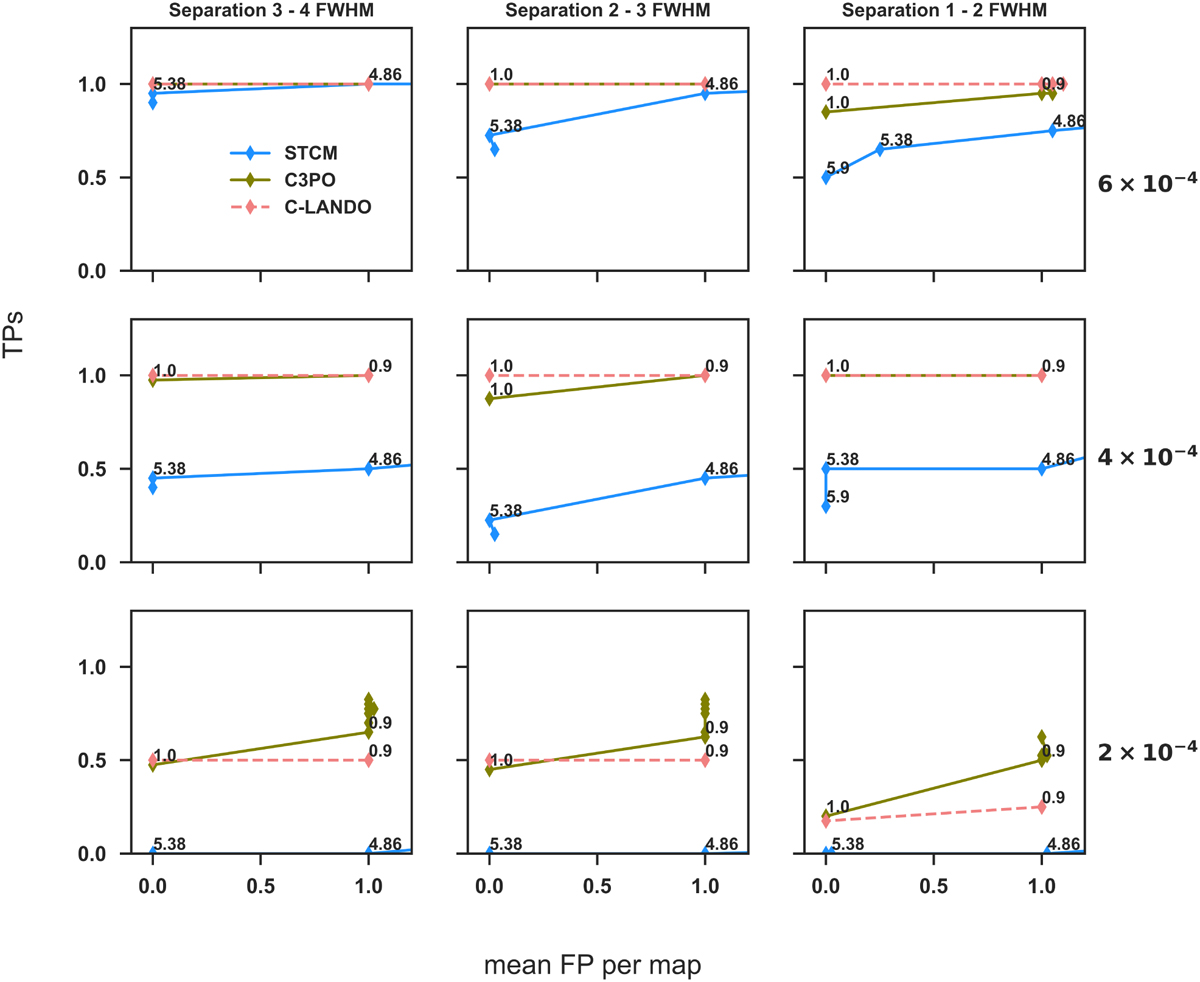
mROC curves produced by inserting a total of 40 exoplanets for a set of contrasts (6 × 10⁻⁴, 4 × 10⁻⁴ and 2 × 10⁻⁴ from top to bottom) at annuli of different separations in the ranges 3–4, 2–3, and 1–2 FWHM (left, middle, and right columns, respectively). The x-axis is the mean FP per map and the y-axis corresponds to the TPR computed using Eq. (2). The numbers next to each data point correspond to the threshold that was applied to compute the number of TPs and FPs for each binary map (as described in Fig. 4).
Current usage metrics show cumulative count of Article Views (full-text article views including HTML views, PDF and ePub downloads, according to the available data) and Abstracts Views on Vision4Press platform.
Data correspond to usage on the plateform after 2015. The current usage metrics is available 48-96 hours after online publication and is updated daily on week days.
Initial download of the metrics may take a while.