Fig. 4
Download original image
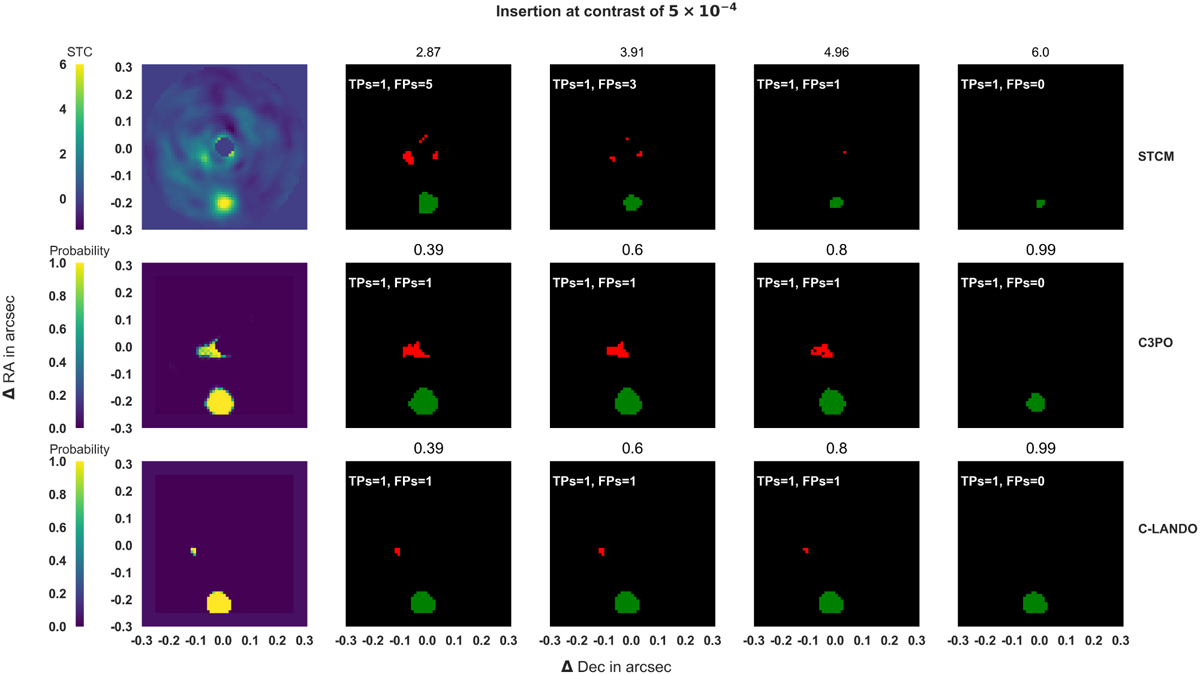
Illustration of the TP and FP counting process. Column 1 shows the detection map used to produce four different binary maps, thresholded at different intensity levels (Cols. 2–5), for the three algorithms (respectively STCM, C3PO, and C-LANDO from top to bottom). A fake companion was inserted at position ΔDec = 0.0 and ΔRA = −0.2. TPs and FPs are respectively shown in green and in red for the thresholds indicated in the titles of each image. Each red blob or point is counted as a single FP or TP, with blobs representing many connected pixels at the same binary intensity level.
Current usage metrics show cumulative count of Article Views (full-text article views including HTML views, PDF and ePub downloads, according to the available data) and Abstracts Views on Vision4Press platform.
Data correspond to usage on the plateform after 2015. The current usage metrics is available 48-96 hours after online publication and is updated daily on week days.
Initial download of the metrics may take a while.