Fig. 1
Download original image
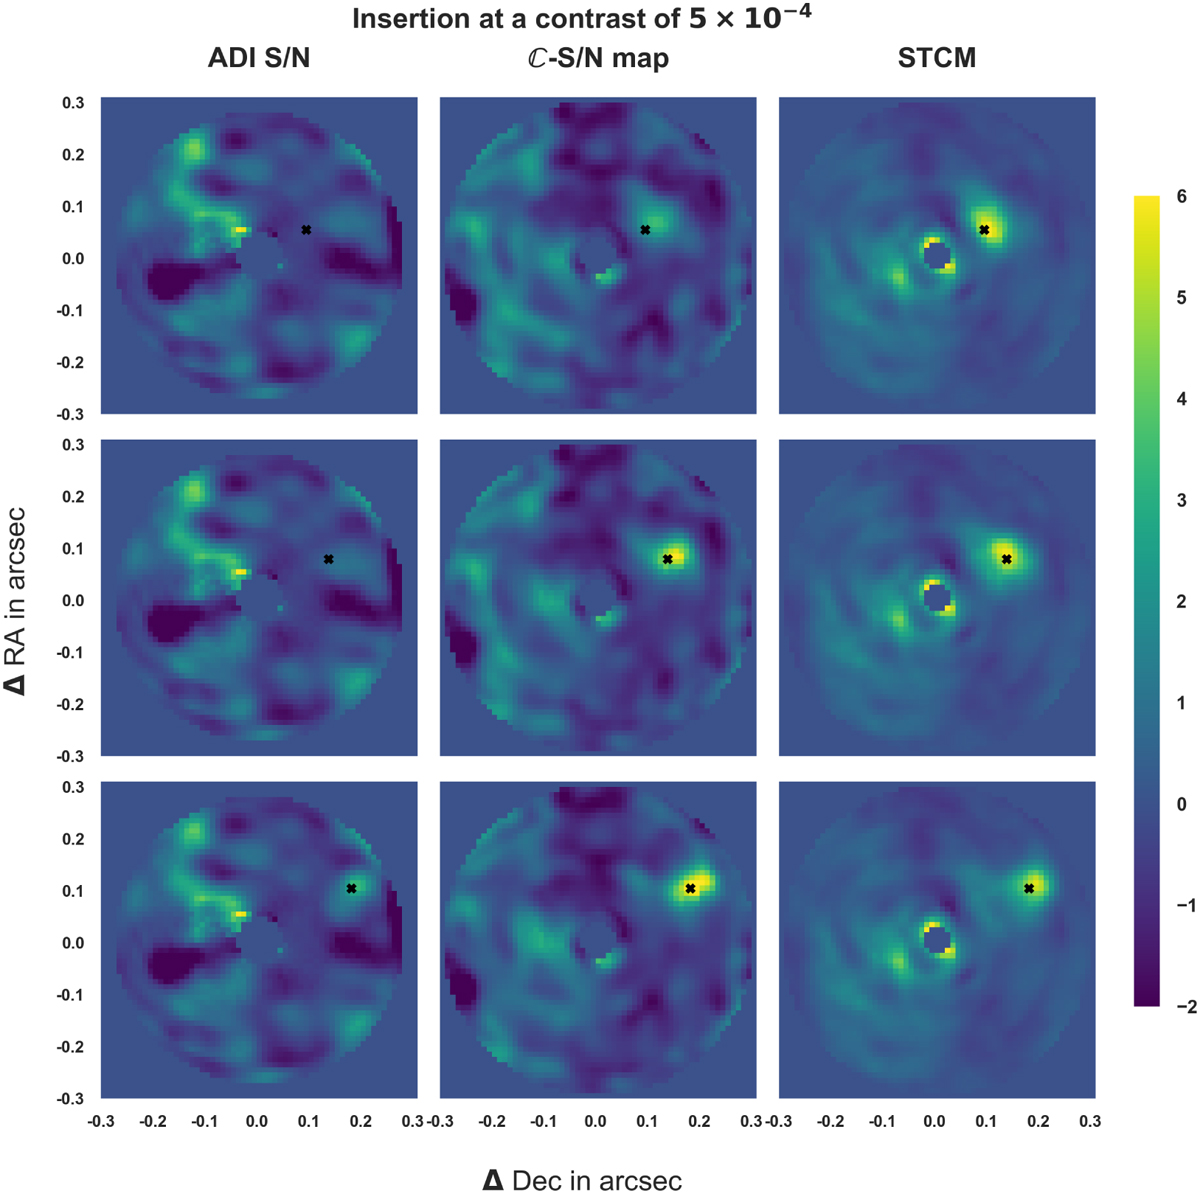
Detection maps obtained with different algorithms, where a young gas giant was inserted at a specific contrast at different separations from the frame centre. Column 1 corresponds to a classical ADI algorithm, where an intensity map is computed for each wavelength, and the S/N map is derived from the median of all the ADI-wavelength maps. Column 2 is obtained by computing an S/N map on the cross-correlation map obtained with υ = 0 km s−1. Column 3 represents the STCM map, produced as described in the text. The rows represent maps produced when the same companion is inserted at different radial separations from the frame centre, respectively at 2.3, 3.3, and 4.3 FWHM. The simulated young gas giant is inserted at the same contrast of 5 × 10⁻⁴ in all maps.
Current usage metrics show cumulative count of Article Views (full-text article views including HTML views, PDF and ePub downloads, according to the available data) and Abstracts Views on Vision4Press platform.
Data correspond to usage on the plateform after 2015. The current usage metrics is available 48-96 hours after online publication and is updated daily on week days.
Initial download of the metrics may take a while.