Fig. 8
Download original image
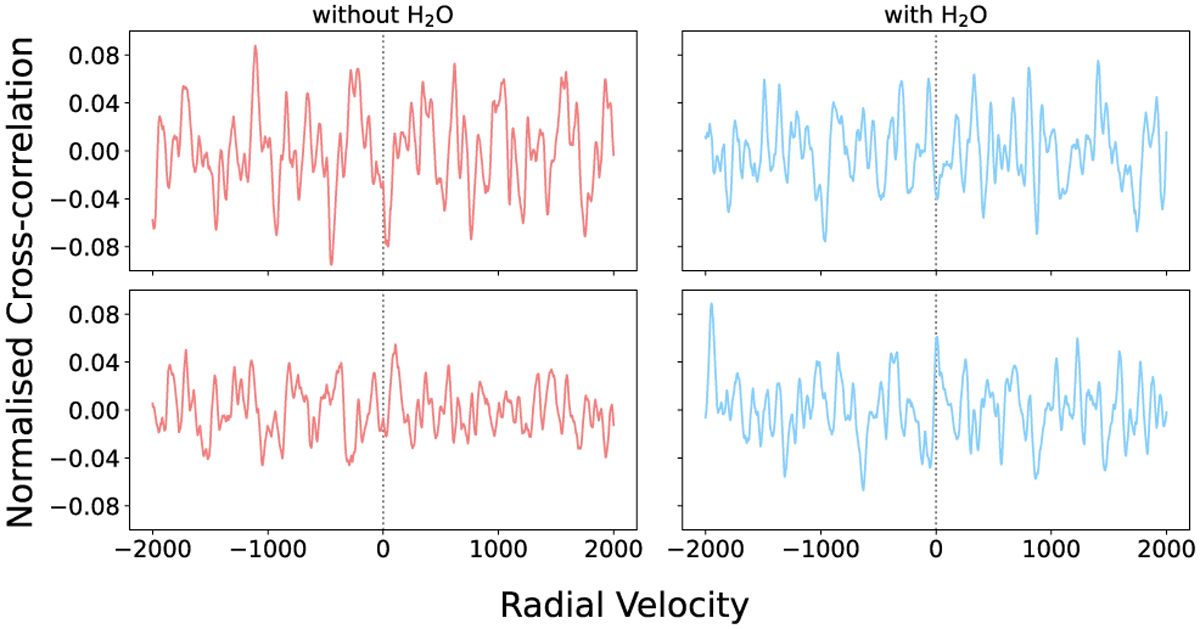
Four randomly selected cross-correlated spectra from the final extracted spectra of companions dataset. For this particular case, the signals were inserted at RV = 0 (dashed vertical line) with a scale factor of eight, which corresponds to an average S/N of ≃0.633. This plot aims to show how the transformed spectra with H2O signals (blue) do not show a visible cross-correlation peak, nor any obvious patterns that differ from the negative group (red); separating the groups based on a S/N statistic is non-trivial.
Current usage metrics show cumulative count of Article Views (full-text article views including HTML views, PDF and ePub downloads, according to the available data) and Abstracts Views on Vision4Press platform.
Data correspond to usage on the plateform after 2015. The current usage metrics is available 48-96 hours after online publication and is updated daily on week days.
Initial download of the metrics may take a while.