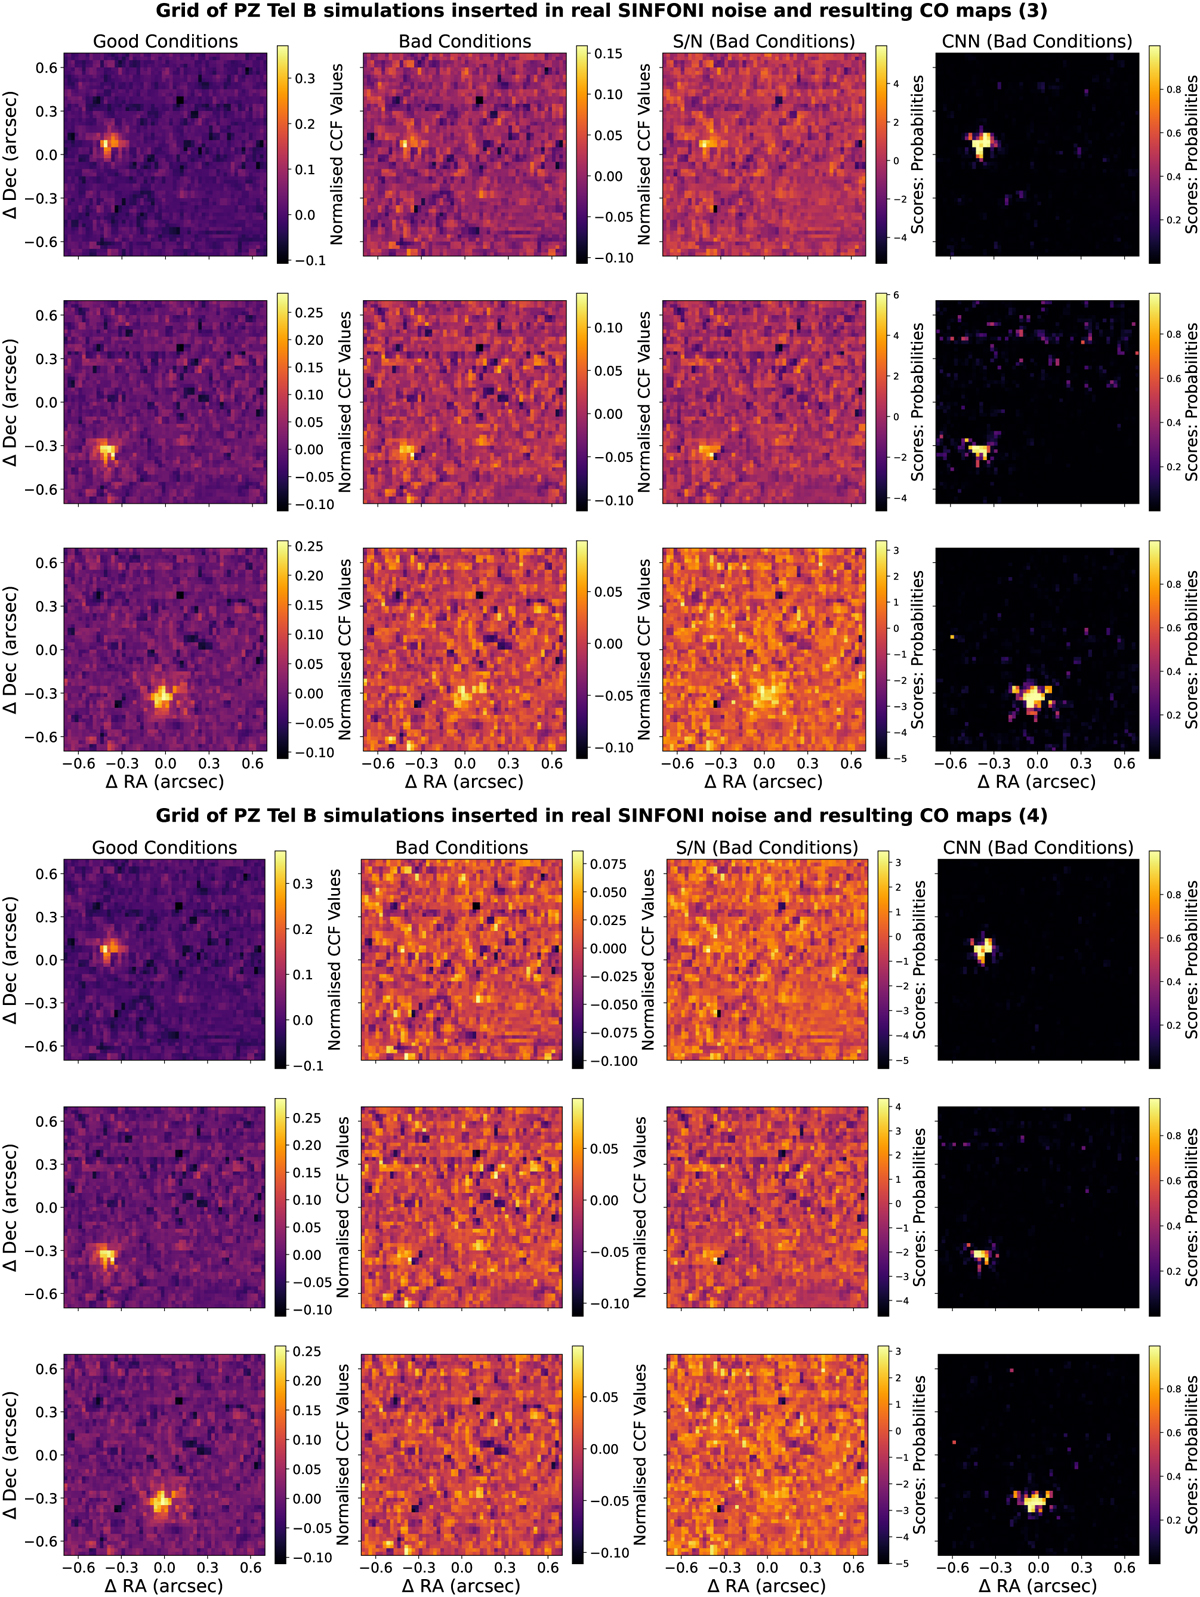
Fig. D.2
Download original image
Scoring results of CO for PZ Tel B simulations in its real noise. Subfigures 3 and 4, column 1: Synthetic brown dwarf insertion with its original average signal strength and decay representing good seeing conditions. Subfigure 3 and 4, col. 2: Insertion of the brown dwarf at 1/3 (Subfigure 1) and at 1/6 (Subfigure 2) of the original signal strength, using noise from the bad seeing conditions. Subfigure 3,4; col. 3,4: S/N maps (col. 3) and CNN maps (col. 4) showing the scoring results for the insertions in bad seeing conditions from col. 2.
Current usage metrics show cumulative count of Article Views (full-text article views including HTML views, PDF and ePub downloads, according to the available data) and Abstracts Views on Vision4Press platform.
Data correspond to usage on the plateform after 2015. The current usage metrics is available 48-96 hours after online publication and is updated daily on week days.
Initial download of the metrics may take a while.