Fig. C.2
Download original image
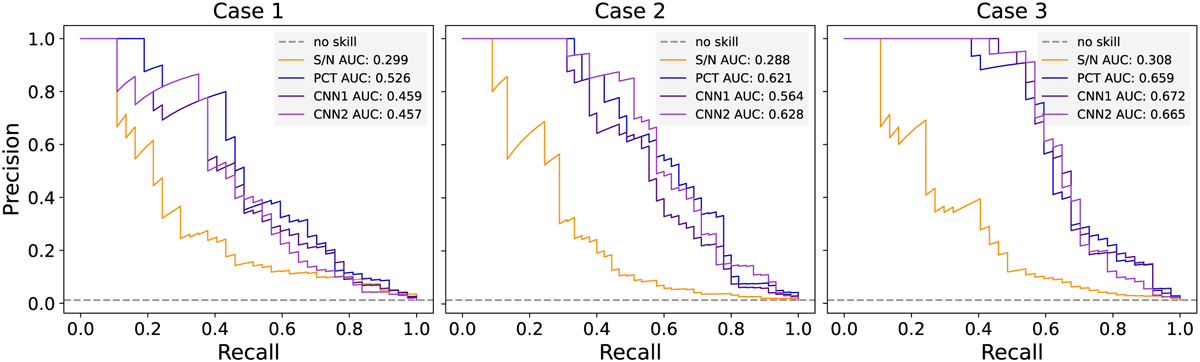
Precision-recall curves related to the three test cases. Each curve is computed based on the scores attributed to each spaxel retrieved from an image cube. The curves represent the trade-off between precision and recall achieved by the scores. A classifier with no skill (grey dashed line) is proportional to the number of positive values in the data; it would perform random, uninformed classification of 0.1% of the of the data to the positive class.
Current usage metrics show cumulative count of Article Views (full-text article views including HTML views, PDF and ePub downloads, according to the available data) and Abstracts Views on Vision4Press platform.
Data correspond to usage on the plateform after 2015. The current usage metrics is available 48-96 hours after online publication and is updated daily on week days.
Initial download of the metrics may take a while.