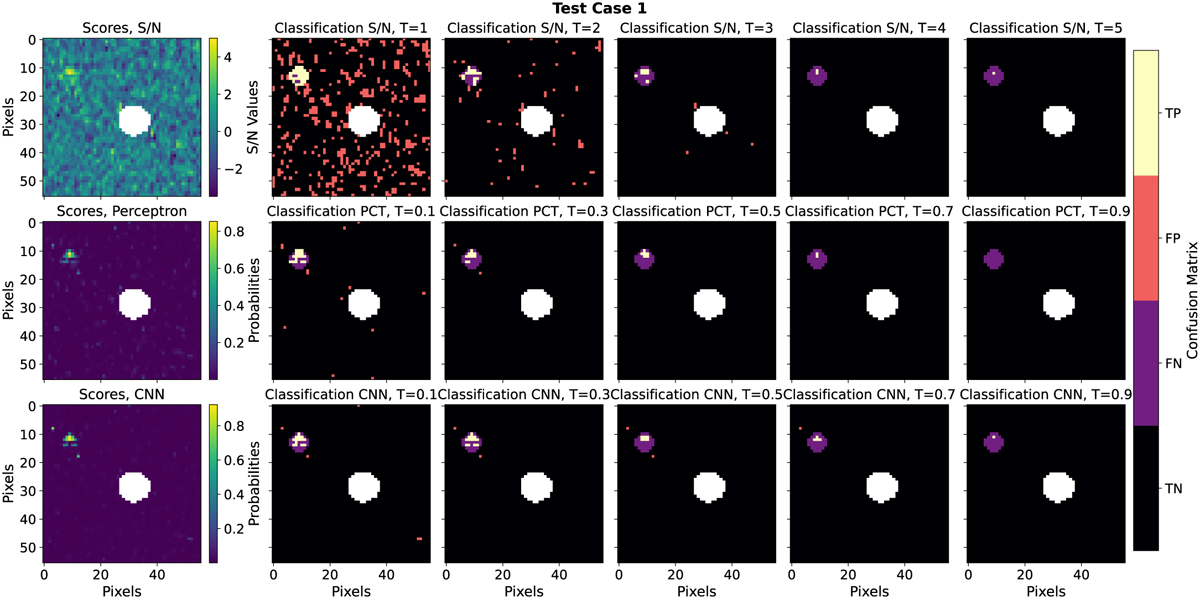
Fig. C.1
Download original image
Reconstruction of classification scores by S/N, PCT, and CNN2 for various test cases (results of CNN1 are redundant). Equivalent benchmarking is challenging, but objectively applied thresholds highlight the distinct behaviour of each method’s scores. First column: Scores are displayed for the three methods in all test cases. From second to sixth column: Classification maps shown according to increasing thresholds, set to T = {1; 2; 3; 4; 5} for S/N and to T = {0.1; 0.3; 0.5; 0.7; 0.9} for MLCCS. Four colours represent the confusion matrix elements: true positives (TP), false positives (FP), false negatives (FN), and true negatives (TN).
Current usage metrics show cumulative count of Article Views (full-text article views including HTML views, PDF and ePub downloads, according to the available data) and Abstracts Views on Vision4Press platform.
Data correspond to usage on the plateform after 2015. The current usage metrics is available 48-96 hours after online publication and is updated daily on week days.
Initial download of the metrics may take a while.