Fig. B.4
Download original image
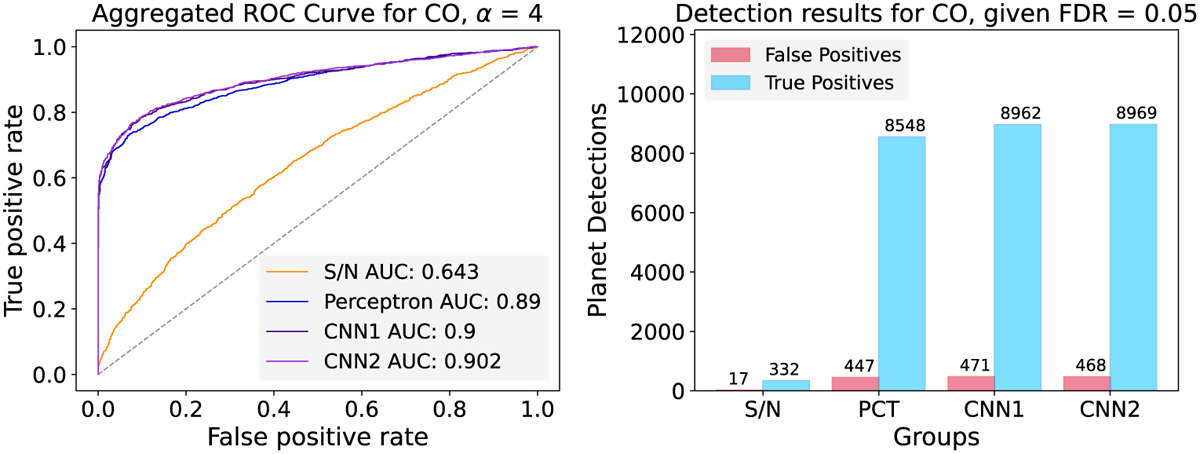
Scoring and classification of the S/N and CNN for cross-correlated spectra with the CO molecule. Left: Quantification of scoring performance with receiver operating characteristic curves (ROC). The plot shows the improvements in the ROC trade-off between TPR and FPR. The improvement is measured in terms of area under the ROC curves (AUC). The CNNs provide even better performance in finding CO molecules while limiting increments in FPR, as compared to the main tests. Right: Maximal amount of planets with CO that can be recovered in the mock data by the S/N, perceptron (PCT) and both CNNs, within a FDR ≤ 5% bound.
Current usage metrics show cumulative count of Article Views (full-text article views including HTML views, PDF and ePub downloads, according to the available data) and Abstracts Views on Vision4Press platform.
Data correspond to usage on the plateform after 2015. The current usage metrics is available 48-96 hours after online publication and is updated daily on week days.
Initial download of the metrics may take a while.