Open Access
Fig. A.1
Download original image
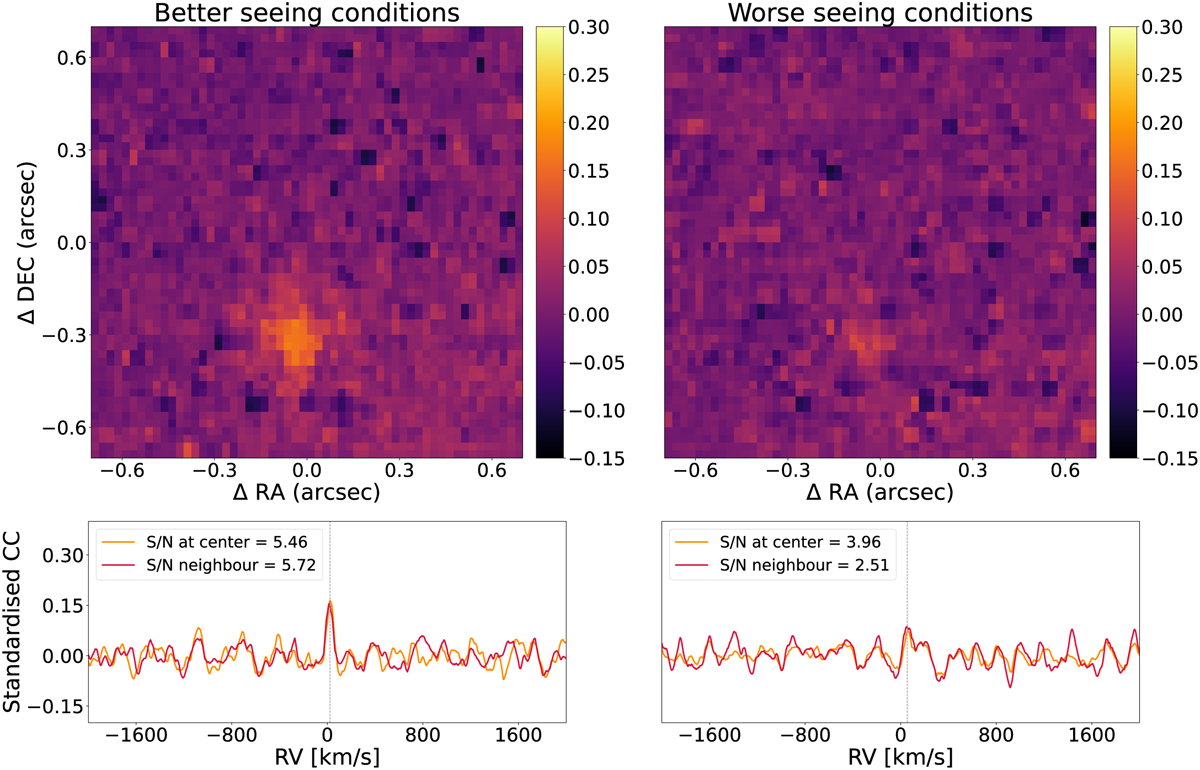
Molecular mapping detection of CO for real PZ Tel B data using cross-correlation for spectroscopy. This figure is an analogue to Fig. 1, applied to the CO molecule instead of H2O. It is even more obvious in the case of CO, that the cross-correlation and molecular maps fail to yield a clear peak under worse conditions.
Current usage metrics show cumulative count of Article Views (full-text article views including HTML views, PDF and ePub downloads, according to the available data) and Abstracts Views on Vision4Press platform.
Data correspond to usage on the plateform after 2015. The current usage metrics is available 48-96 hours after online publication and is updated daily on week days.
Initial download of the metrics may take a while.