Fig. 13
Download original image
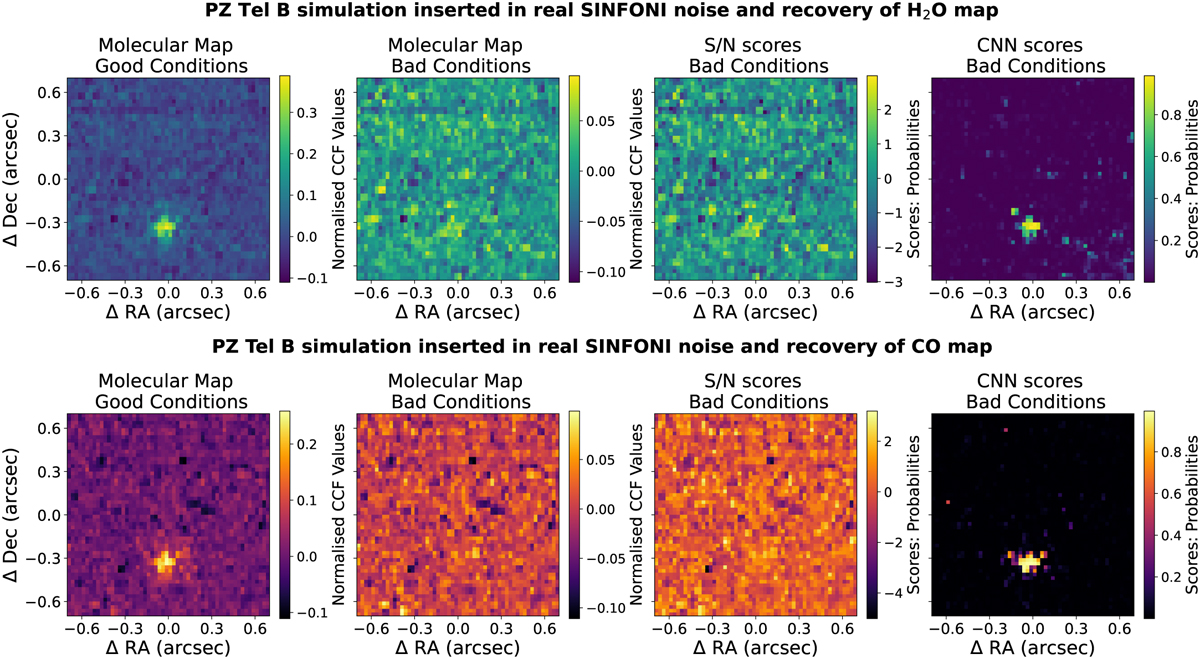
Simulated molecular maps and reconstruction of the predicted classification scores by the S/N and CNN. Left: insertion of a simulated PZ Tel В signal in the real PZ Tel В noise cubes, with same location, Gaussian decay and average S/N = 7.3 as the real data shown as a molecular map in good seeing conditions. Middle-left: insertion of a signal in the PZ Tel B data with location and Gaussian decay of the original signal, but with an average S /N = 1.22 to emulate a signal in bad seeing conditions. Middle-right: S/N probability scores for bad seeing conditions. The planet is not detectable at S/N = 5. Right: CNN probability scores for bad seeing conditions. A very clear conspicuity improvement is observed in probabilistic map, clearly enhancing the planet’s visibility.
Current usage metrics show cumulative count of Article Views (full-text article views including HTML views, PDF and ePub downloads, according to the available data) and Abstracts Views on Vision4Press platform.
Data correspond to usage on the plateform after 2015. The current usage metrics is available 48-96 hours after online publication and is updated daily on week days.
Initial download of the metrics may take a while.