Fig. 12
Download original image
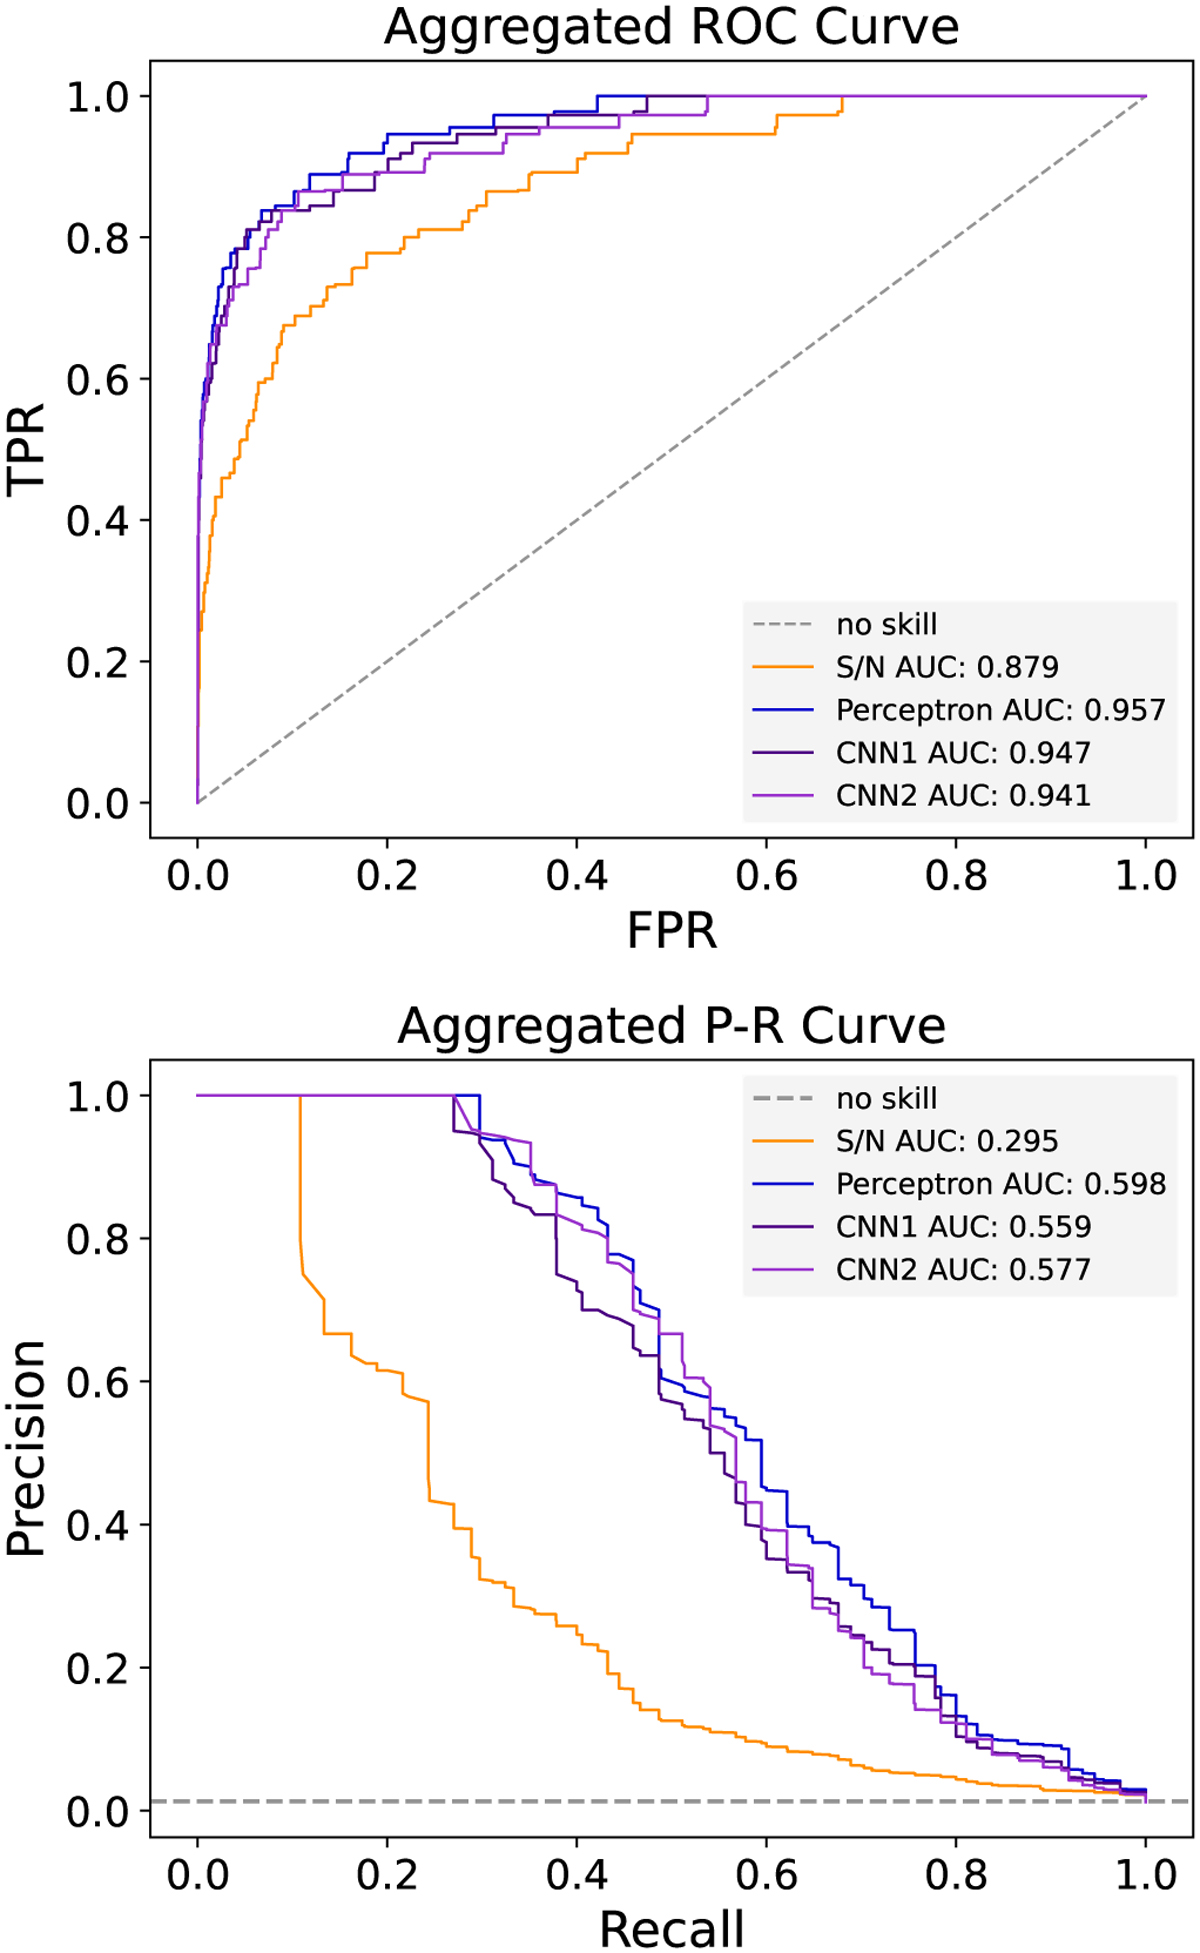
Aggregated ROC and PR curves for the directly imaged companions dataset. We used ROC and PR AUCs to quantify of the scoring quality of the ML methods relative to S/N. The ROC curves measure the trade-off between TPR and FPR; however, they tend to be over-optimistic in highly balanced frameworks, such as in imaging data. The P-R curves measure the trade-off between precision and recall.
Current usage metrics show cumulative count of Article Views (full-text article views including HTML views, PDF and ePub downloads, according to the available data) and Abstracts Views on Vision4Press platform.
Data correspond to usage on the plateform after 2015. The current usage metrics is available 48-96 hours after online publication and is updated daily on week days.
Initial download of the metrics may take a while.