Open Access
Fig. 11
Download original image
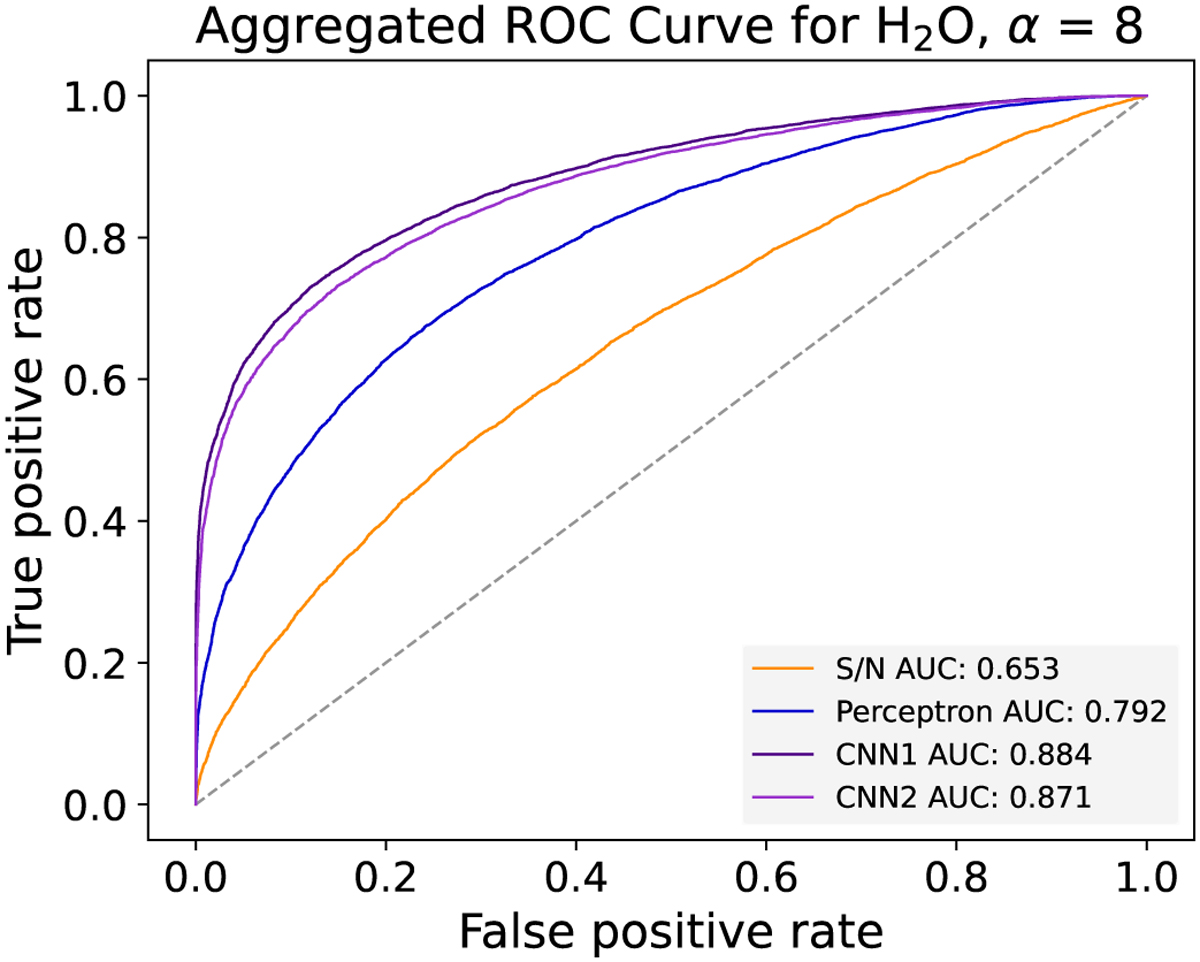
Quantification of scoring performance with ROC curves. The plot shows the improvements in the ROC trade-off between TPR and FPR. The improvement is measured in terms of area under the ROC curves (AUC). The CNNs outperform the baselines in finding true positives while limiting the increase in FPR.
Current usage metrics show cumulative count of Article Views (full-text article views including HTML views, PDF and ePub downloads, according to the available data) and Abstracts Views on Vision4Press platform.
Data correspond to usage on the plateform after 2015. The current usage metrics is available 48-96 hours after online publication and is updated daily on week days.
Initial download of the metrics may take a while.