Fig. 10
Download original image
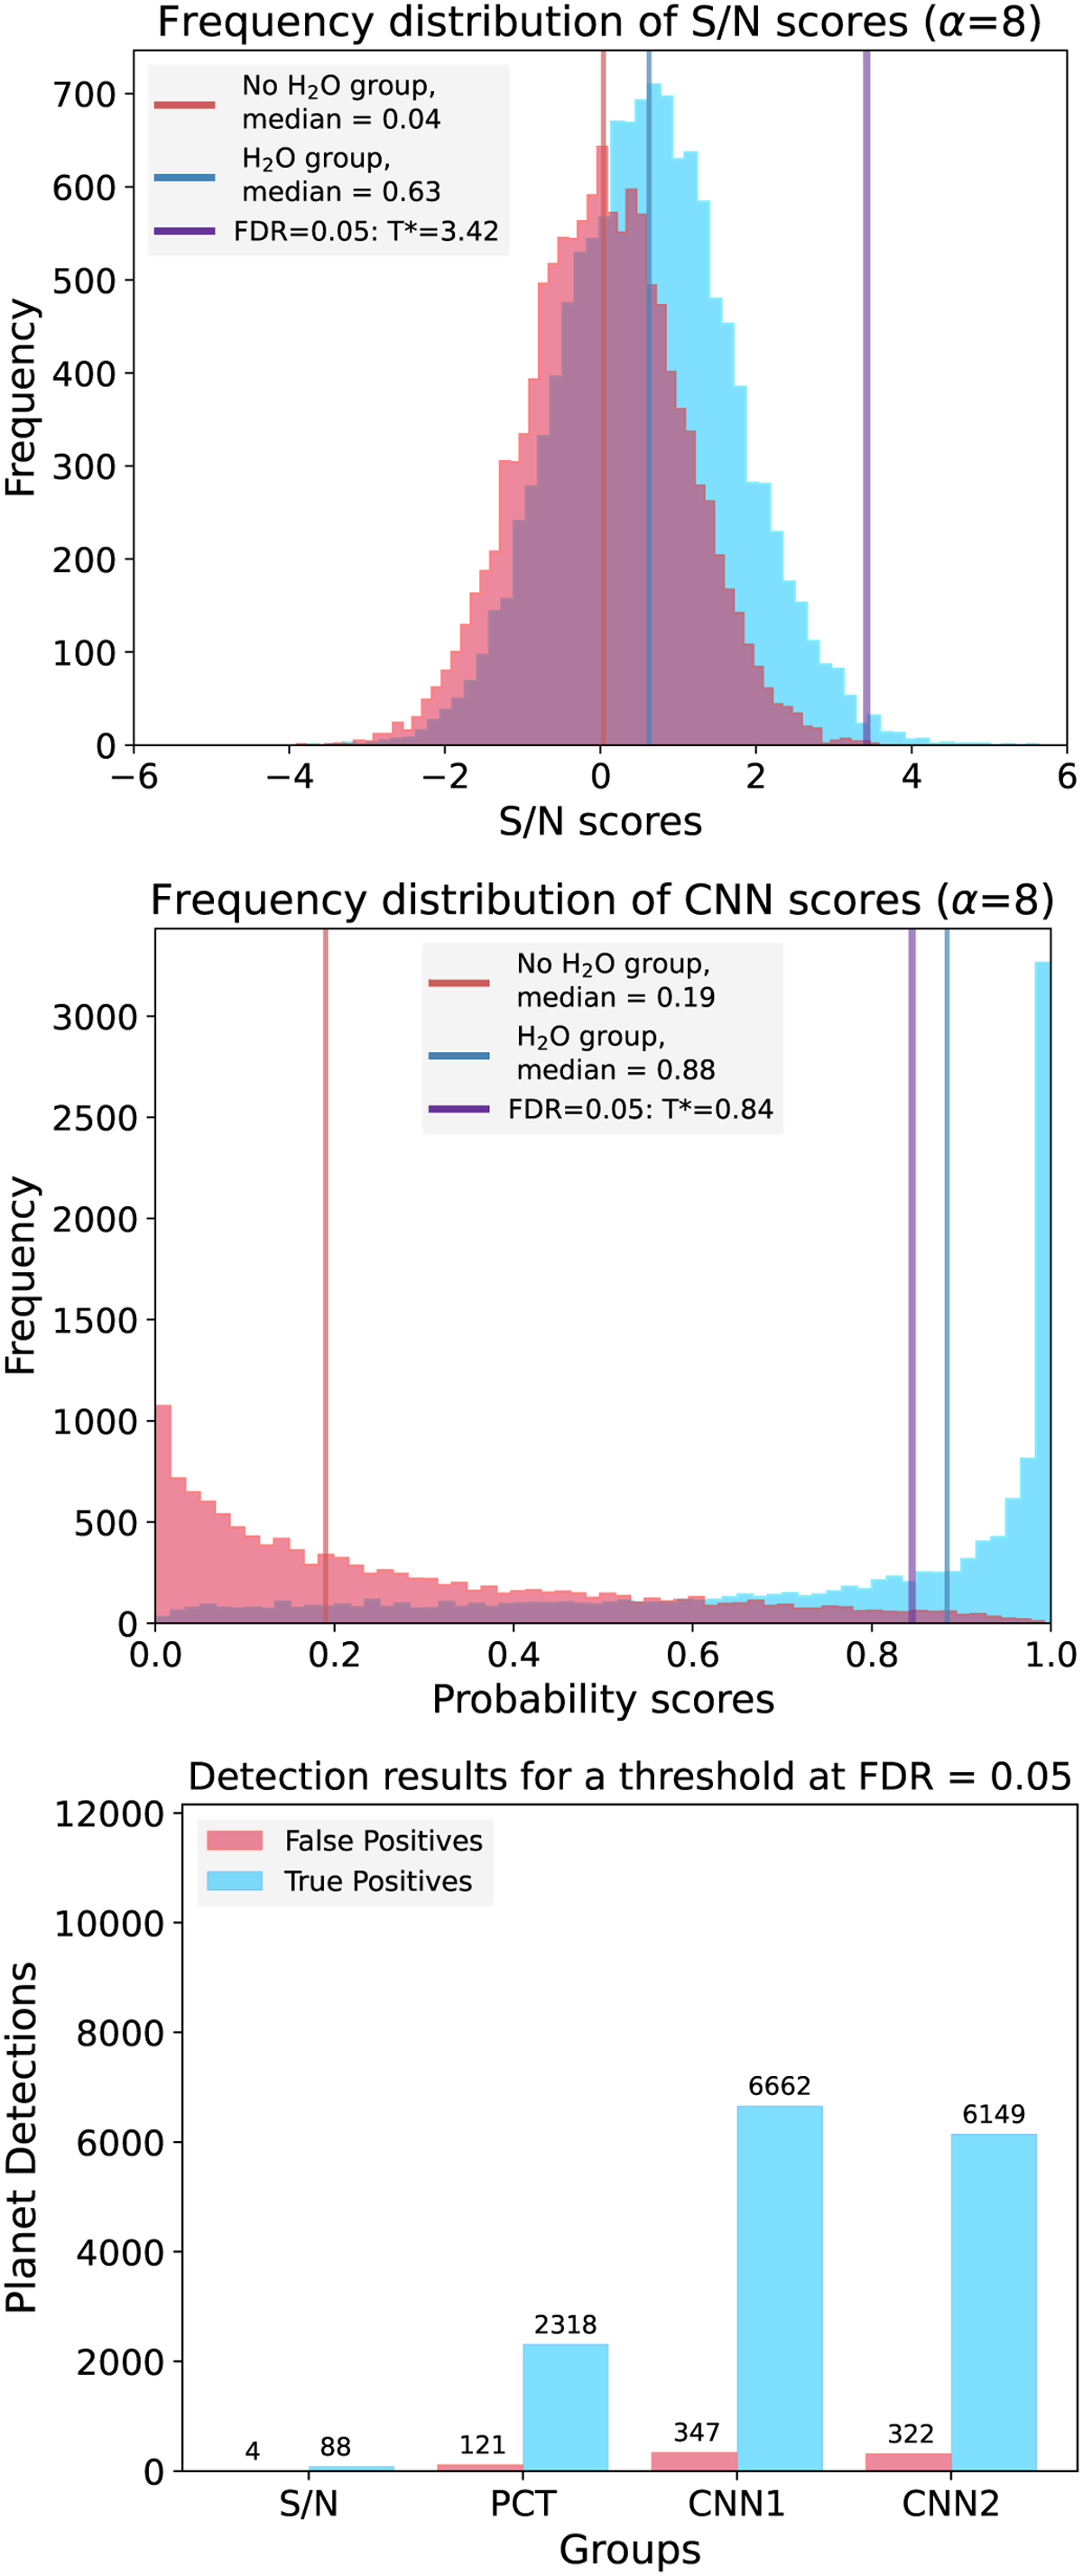
Scoring and classification of the S/N and CNN. Top and middle: frequency distributions of aggregated scores assigned to the negative group (red) against the positive group (blue) for both methods. The scores represent the predicted likelihood of a given spectrum to belong to the positive group. The probabilistic scores assigned by the CNN provide a better separation of the groups (i.e. “conspicuity”) than S/N scores. Classification predictions are set by a threshold for a FDR at 5%. Lower: maximal amount of planets recovered in the mock data by the S/N, perceptron (PCT) and both CNNs, within a maximal FDR of 5%.
Current usage metrics show cumulative count of Article Views (full-text article views including HTML views, PDF and ePub downloads, according to the available data) and Abstracts Views on Vision4Press platform.
Data correspond to usage on the plateform after 2015. The current usage metrics is available 48-96 hours after online publication and is updated daily on week days.
Initial download of the metrics may take a while.