Fig. 1
Download original image
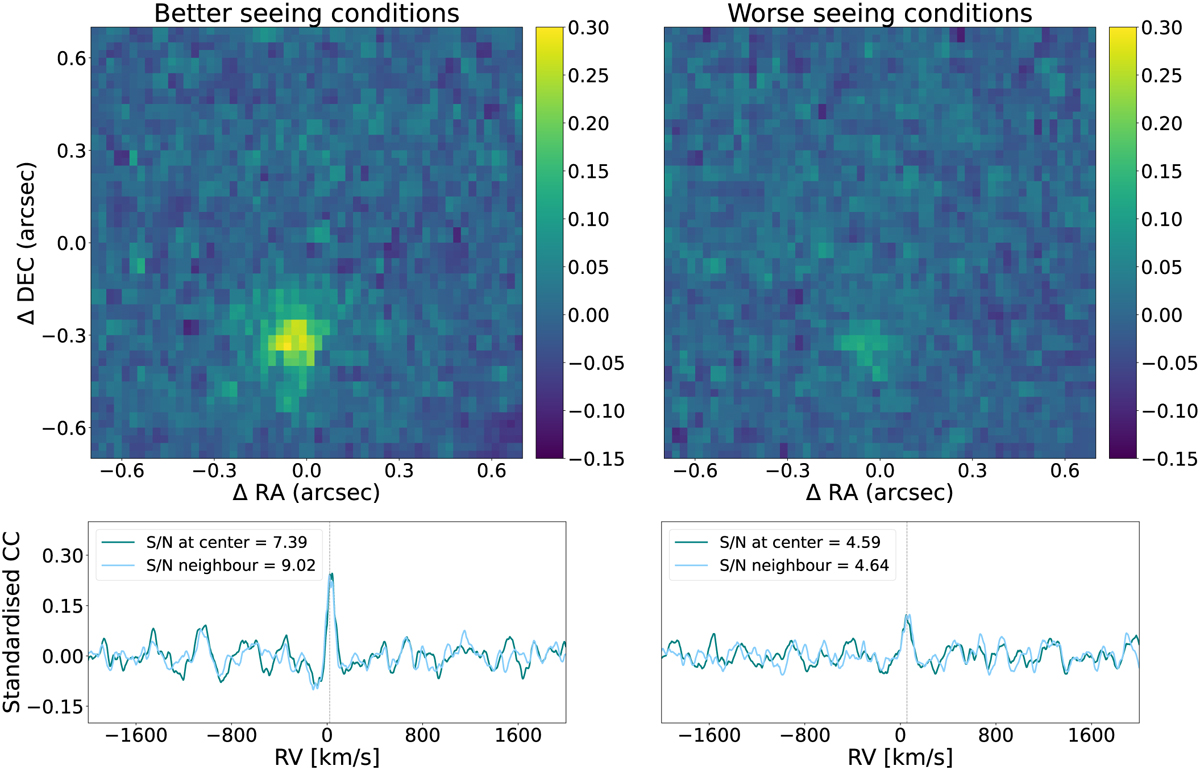
Molecular maps of H2O for real PZ Tel B data using CCS. This figure shows a real case example where the noise structures may reduce detection capabilities of cross-correlation methods. The brown dwarf was observed under good conditions (airmass: 1.11, Seeing start to end: 0.77–0.72) and lower conditions (airmass: 1.12, Seeing: 1.73-1.54), cf. Appendix A for full details on observing conditions. Upper plots show molecular maps of PZ Tel B, while the lower plots show the cross-correlation series along the radial velocity (RV) support for pixels at the centre of the object, and within the object’s brightness area. While the brown dwarf should appear at the same spatial coordinates for respective RV locations in both cases (cf. vertical lines), it is clearly visible when conditions are good, but hardly visible on equal scales under lower conditions.
Current usage metrics show cumulative count of Article Views (full-text article views including HTML views, PDF and ePub downloads, according to the available data) and Abstracts Views on Vision4Press platform.
Data correspond to usage on the plateform after 2015. The current usage metrics is available 48-96 hours after online publication and is updated daily on week days.
Initial download of the metrics may take a while.