Fig. 6
Download original image
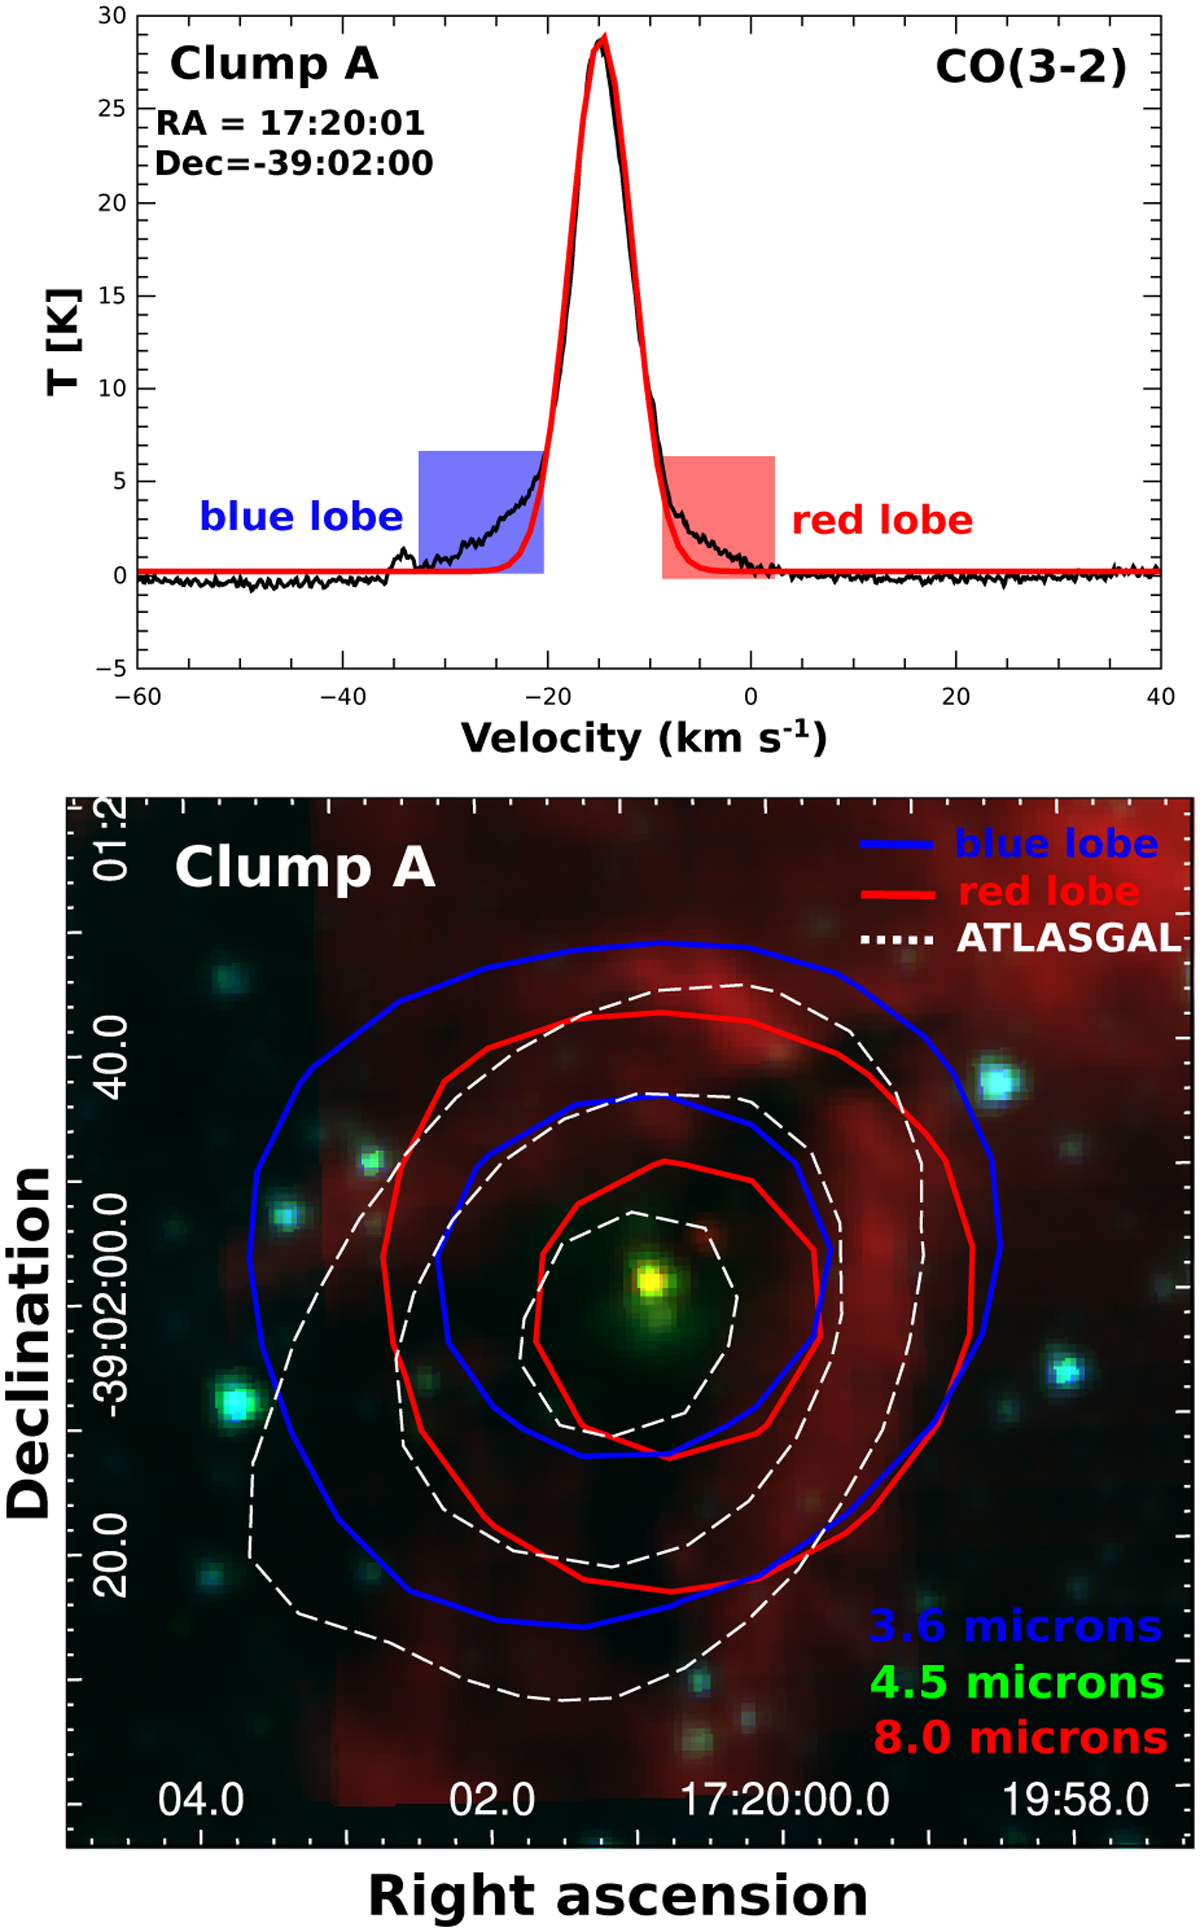
Beam-averaged CO(3−2) spectrum toward the center of the clump A (top). The blue and red wings have been highlighted in their respective colors. Three color Spitɀer image with 3.6, 4.5, and 8.0 µm emissions (bottom) seen in blue, green, and red, respectively. The white contours represent the 870 µm ATLASGAL emission. Levels are at 0.5, 1, and 2 Jy beam−1. The blue and red contours correspond to the CO emission integrated between −33 km s−1 and −20 km s−1 and between −7 km s−1 and +3 km s−1, respectively. They are indicating the possible molecular outflow activity in the line of sight toward clump A.
Current usage metrics show cumulative count of Article Views (full-text article views including HTML views, PDF and ePub downloads, according to the available data) and Abstracts Views on Vision4Press platform.
Data correspond to usage on the plateform after 2015. The current usage metrics is available 48-96 hours after online publication and is updated daily on week days.
Initial download of the metrics may take a while.