Fig. 5
Download original image
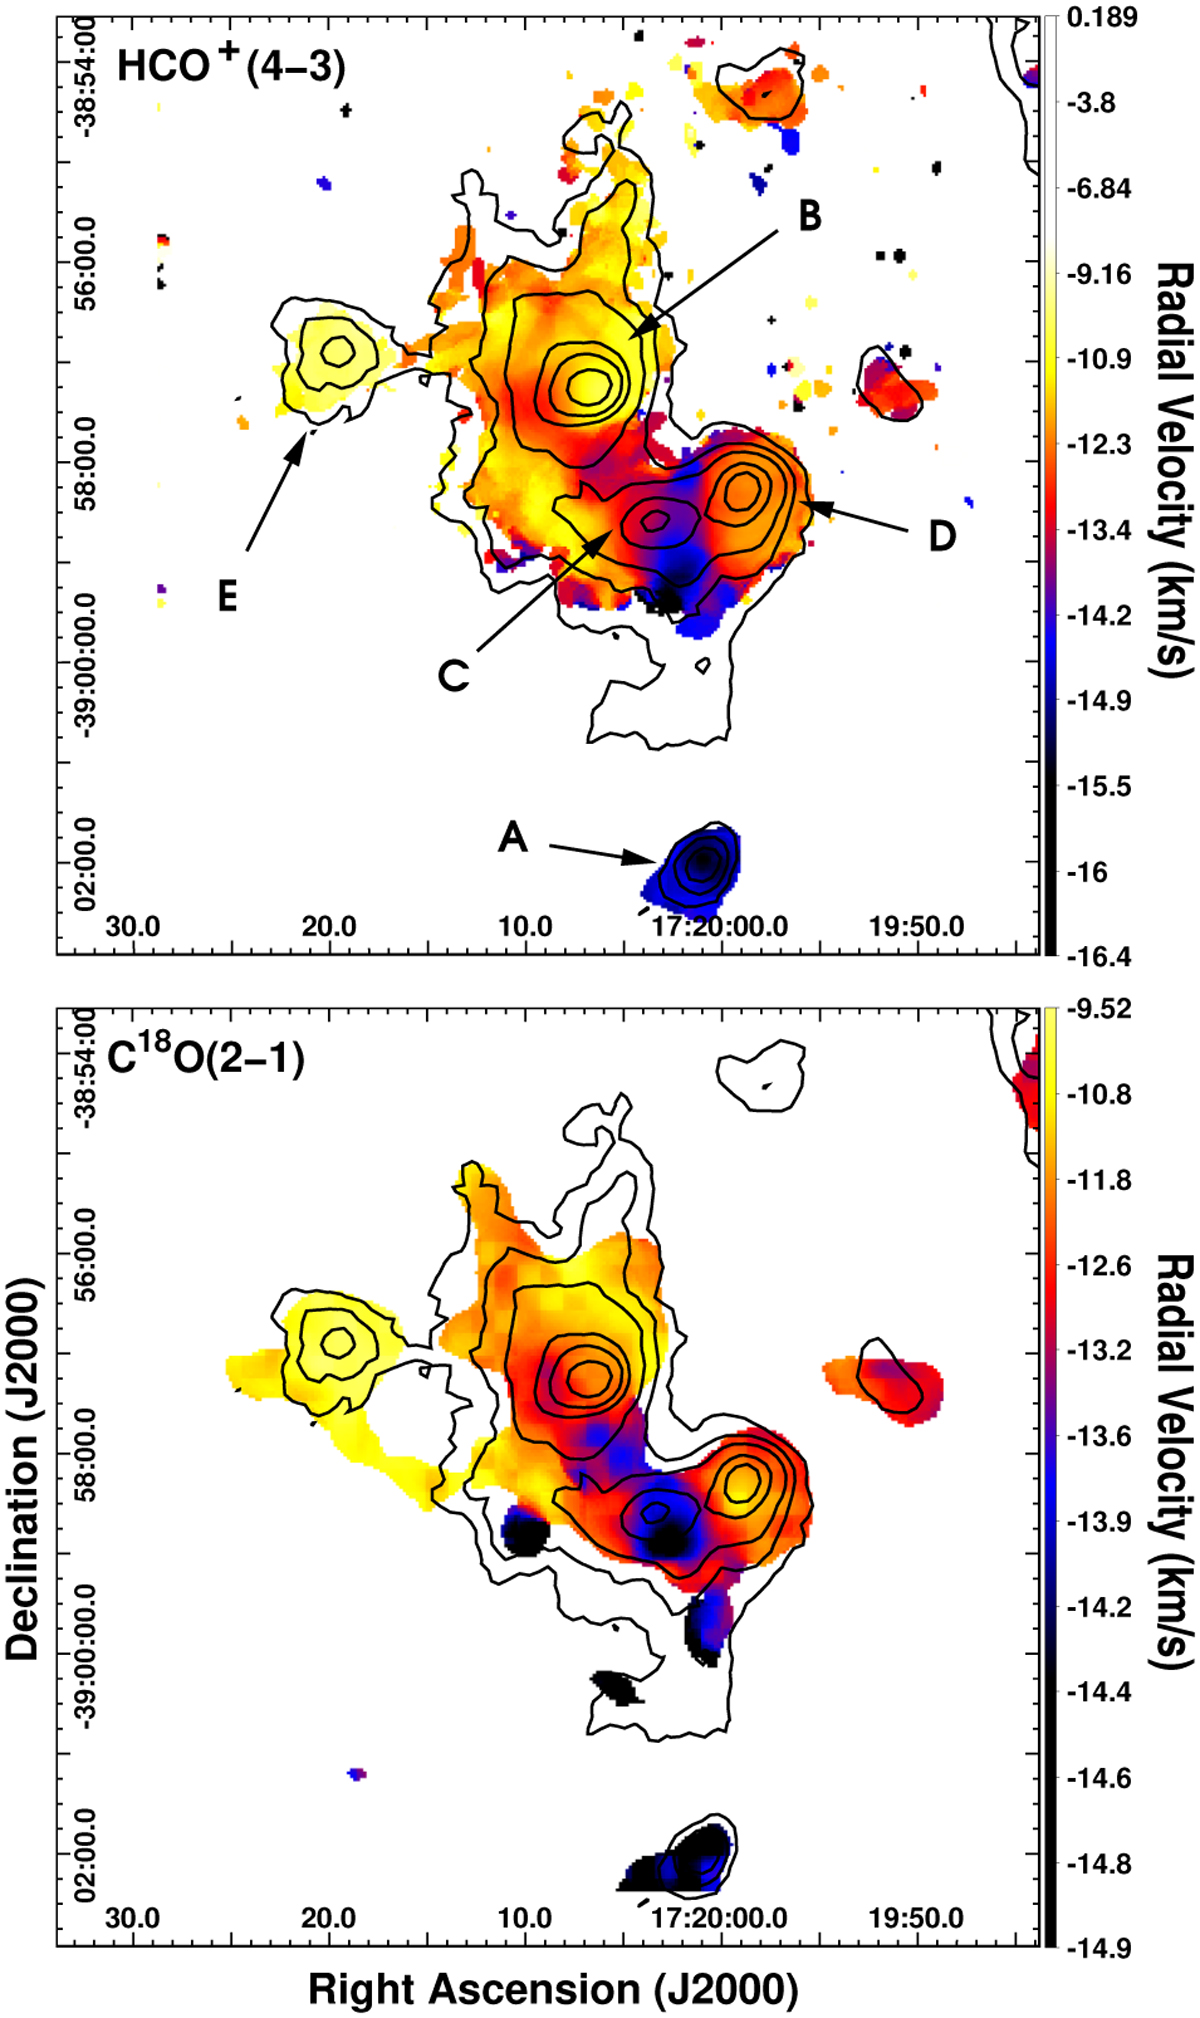
First-order moment maps of the HCO+ (4−3) emission line (upper panel) and C18O(2–l) emission line (lower panel). The black contours represent the ATLASGAL 870 µm emission, as presented in Fig. 1. Black labels and arrows in the upper panel indicate the identified molecular clumps. Color tonalities represent different LSR radial velocities.
Current usage metrics show cumulative count of Article Views (full-text article views including HTML views, PDF and ePub downloads, according to the available data) and Abstracts Views on Vision4Press platform.
Data correspond to usage on the plateform after 2015. The current usage metrics is available 48-96 hours after online publication and is updated daily on week days.
Initial download of the metrics may take a while.