Open Access
Fig. 4
Download original image
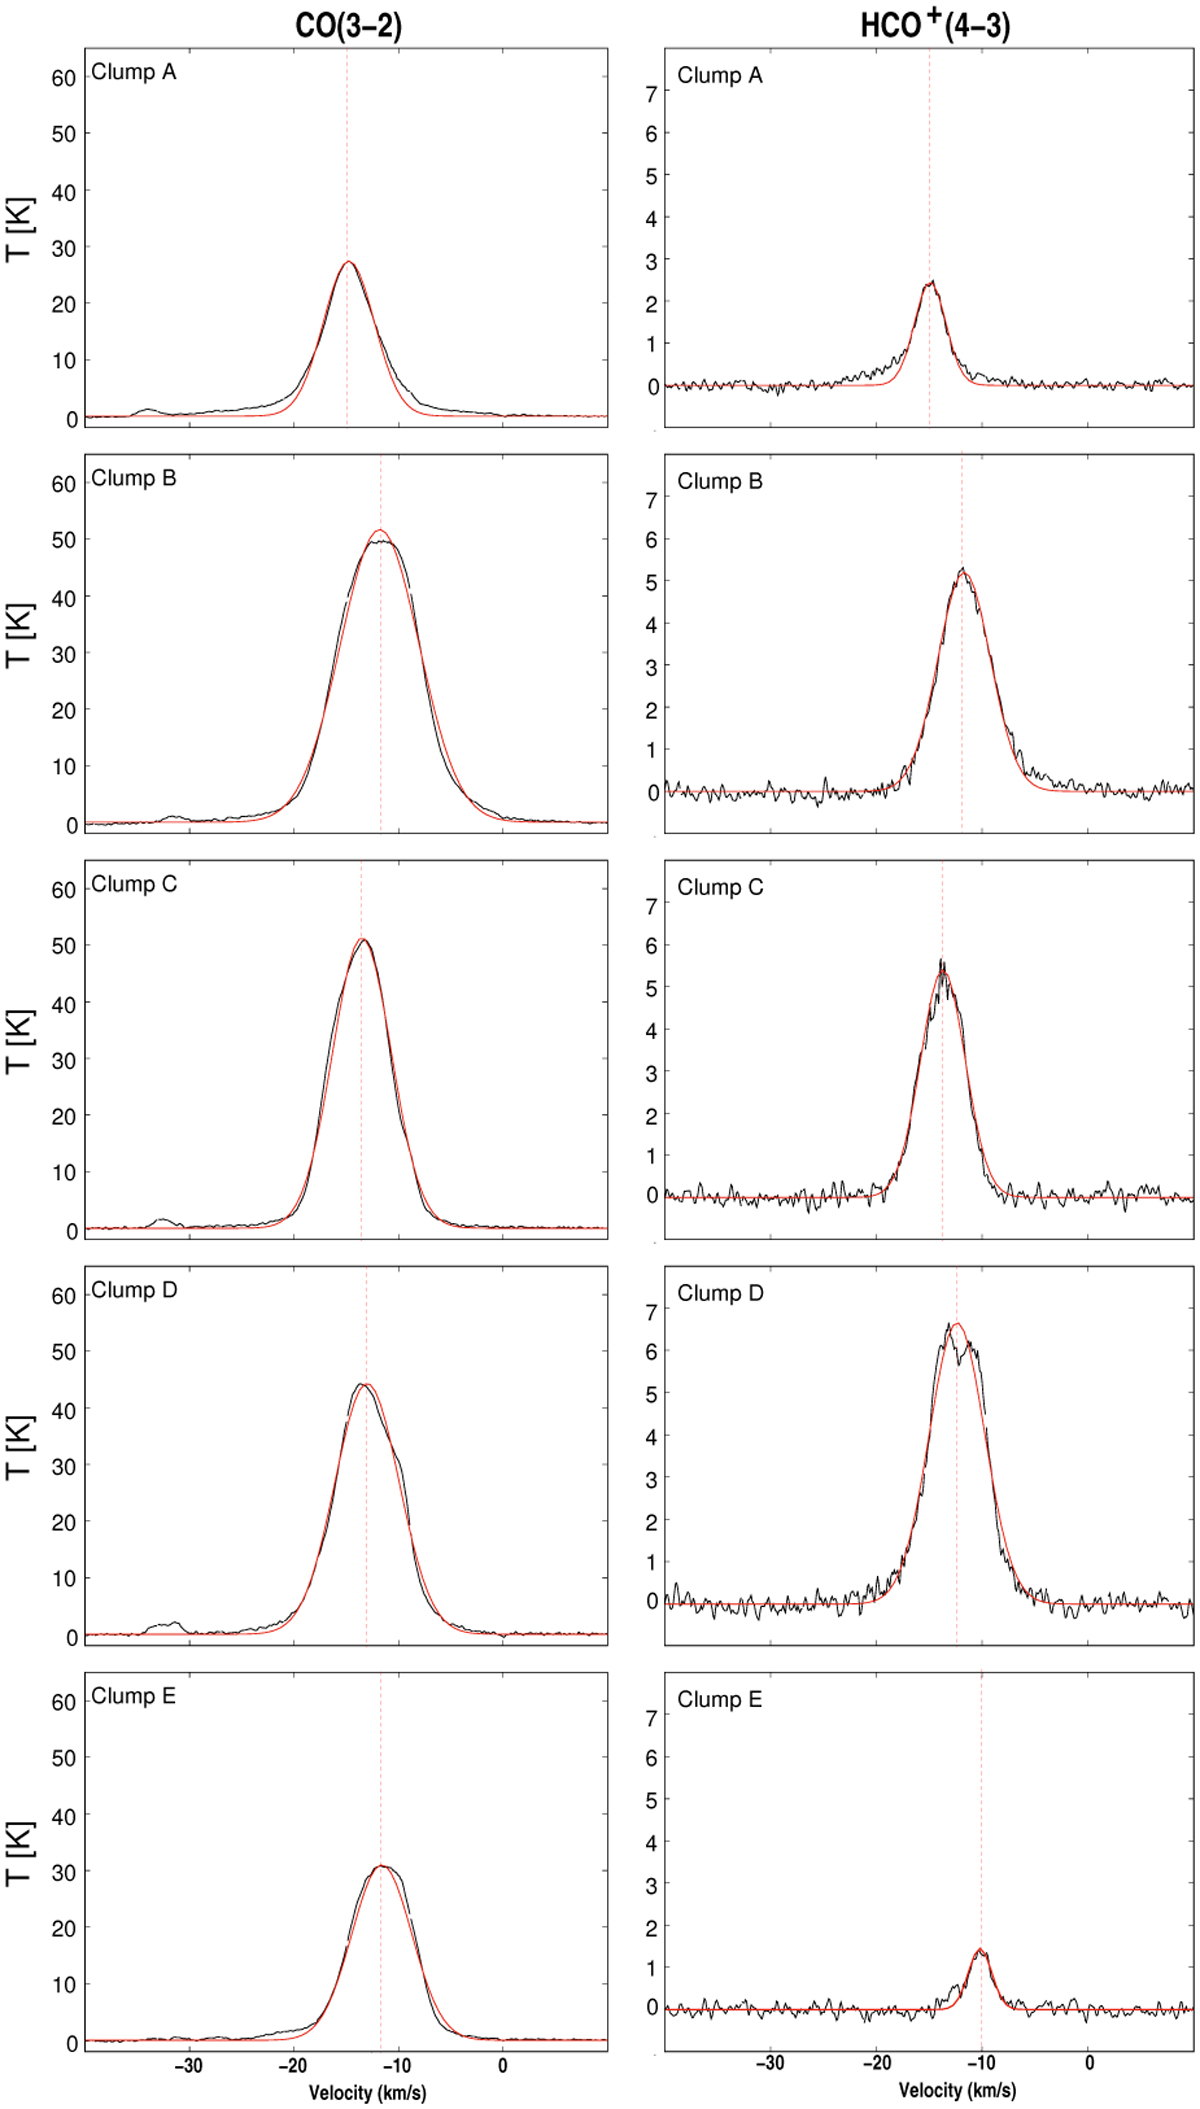
Averaged CO(3−2) and HCO+(4−3) line spectra obtained toward the emission peak of molecular clumps A, B, C, D, and E. The red curves show the Gaussian fits to the lines. Vertical red dotted lines indicate the central velocities from the Gaussian fits.
Current usage metrics show cumulative count of Article Views (full-text article views including HTML views, PDF and ePub downloads, according to the available data) and Abstracts Views on Vision4Press platform.
Data correspond to usage on the plateform after 2015. The current usage metrics is available 48-96 hours after online publication and is updated daily on week days.
Initial download of the metrics may take a while.