Fig. 3
Download original image
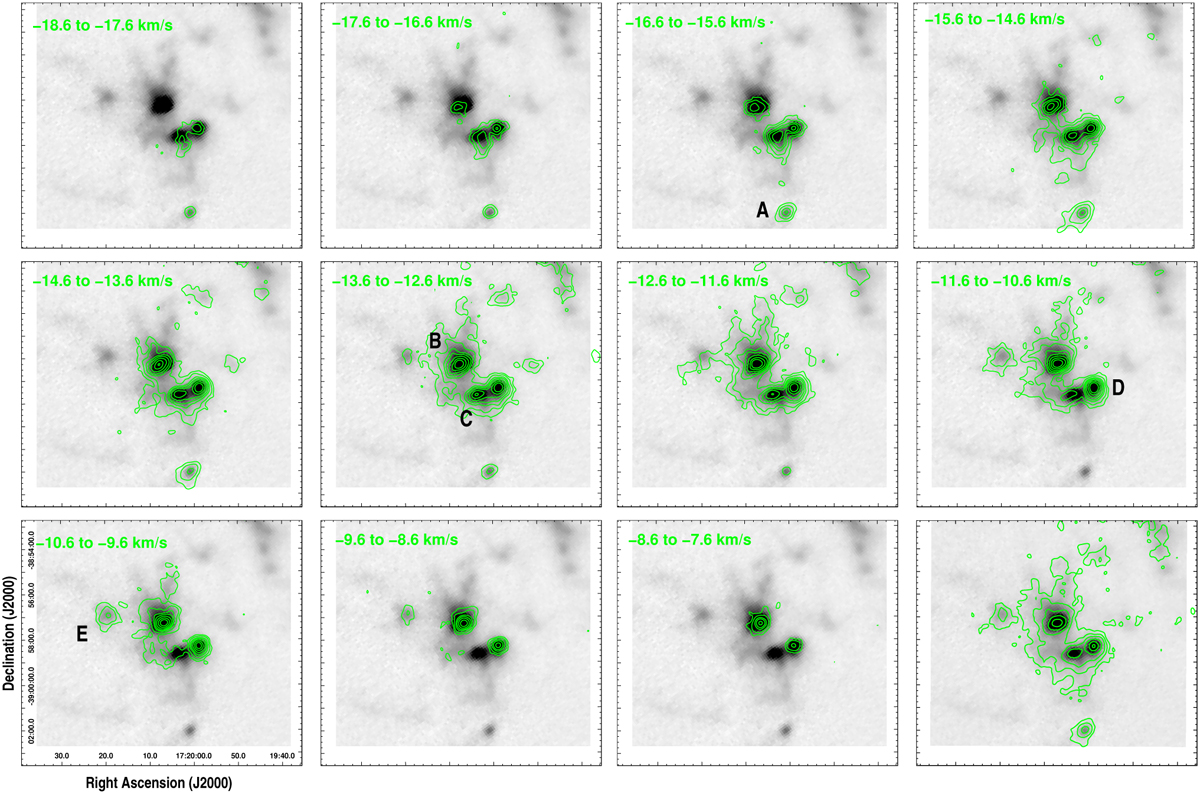
Channel maps of the HCO+ (4−3) emission (green contours) in velocity intervals of 1 km s−1, covering the total velocity interval from −18.6 to −6.6 km s−1 superimposed on the 870 µm continuum emission (grey tonalities). The velocity interval is indicated in the upper left corner of each image. The contour levels are 0.65 (~6 rms), 1.3, 2.5, 3.5, 5, 7, and 9 K km s−1. The bottom right panel shows the emission of the line integrated into the total velocity range. The contour levels are 0.23 (~7 rms), 0.55, 1.2, 1.8, 5, and 7.2 K km s−1.
Current usage metrics show cumulative count of Article Views (full-text article views including HTML views, PDF and ePub downloads, according to the available data) and Abstracts Views on Vision4Press platform.
Data correspond to usage on the plateform after 2015. The current usage metrics is available 48-96 hours after online publication and is updated daily on week days.
Initial download of the metrics may take a while.