Fig. 13
Download original image
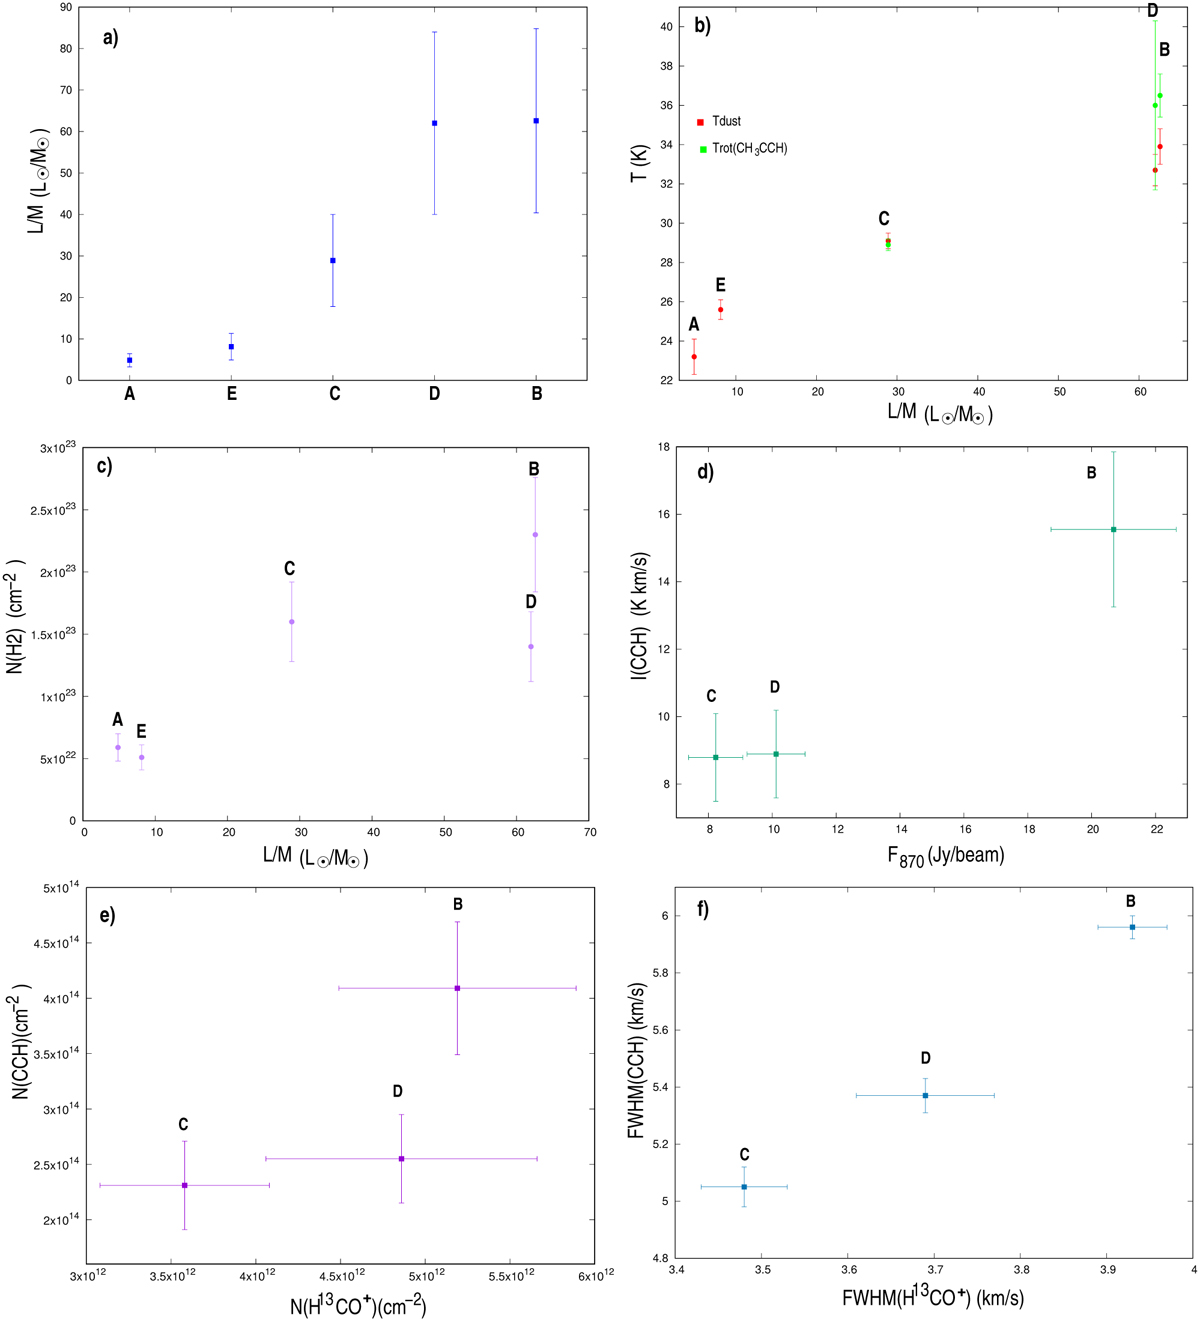
(a) Luminosity-mass ratio of the clumps arranged in the proposed evolutionary sequence. (b) Luminosity-mass vs. temperature determined from CO, submillimeter, and CH3CCH emissions. (c) Luminosity-mass vs. column density determined from CO and submillimeter emissions. (d) 870 µm peak flux density vs. CCH integrated intensity. (e) Column density plot of H13CO+ vs. CCH. (f) Full width at half maximum plot of H13CO+(3−2) vs. CCH(35/2.3–23/2.2).
Current usage metrics show cumulative count of Article Views (full-text article views including HTML views, PDF and ePub downloads, according to the available data) and Abstracts Views on Vision4Press platform.
Data correspond to usage on the plateform after 2015. The current usage metrics is available 48-96 hours after online publication and is updated daily on week days.
Initial download of the metrics may take a while.