Fig. 12
Download original image
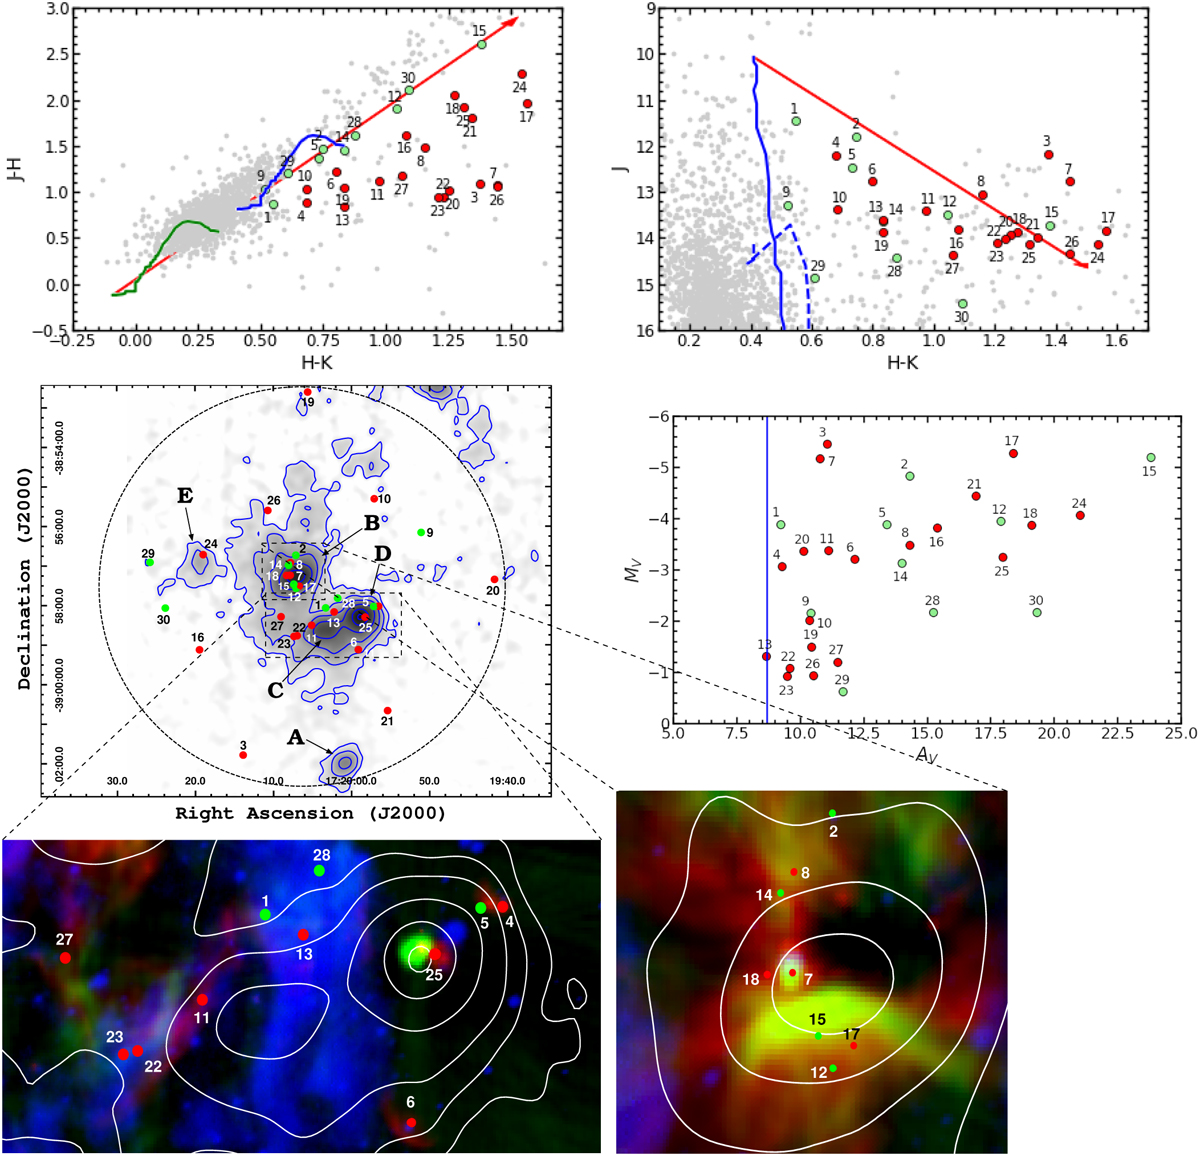
Studied region of RCW 122. Upper panels: IR photometric diagrams for those sources with J < 16 and located inside the 5′ radius around the center of the complex. Gray symbols indicate no classified stars, most of them are likely to be field population. Green and blue curves are the MS (see text) shifted according to the adopted distance modulus with and without absorption/reddening, respectively. The dashed blue curve in the CMD is the 1 Myr isochrone for z = 0 : 02 from Siess et al. 2000. Red lines indicate the considered reddening path. The location of the shifted MS and the reddening vector indicates the adopted range in color excess. Green symbols correspond to MS stars and red ones correspond to stars with probable IR excess. Middle left panel: total velocity integrated HCO+(4−3) emission levels as presented in Fig. 3. Clumps A to E are indicated in black labels. The black dashed circle indicates the 5’ radius adopted for the cluster. Symbols are considered cluster members. Middle right panel: absolute magnitudes (MV) vs. absorptions (AV) obtained from the photometric diagrams (see text). Lower panels: zoom-in view of the central regions of clump B, C, and D. Red, green, and blue tonalities depict 8 µm, 3GHz continuum, and Hα emissions, respectively, while white contours represent the HCO+(4−3) emission as presented in the middle left panel.
Current usage metrics show cumulative count of Article Views (full-text article views including HTML views, PDF and ePub downloads, according to the available data) and Abstracts Views on Vision4Press platform.
Data correspond to usage on the plateform after 2015. The current usage metrics is available 48-96 hours after online publication and is updated daily on week days.
Initial download of the metrics may take a while.