Open Access
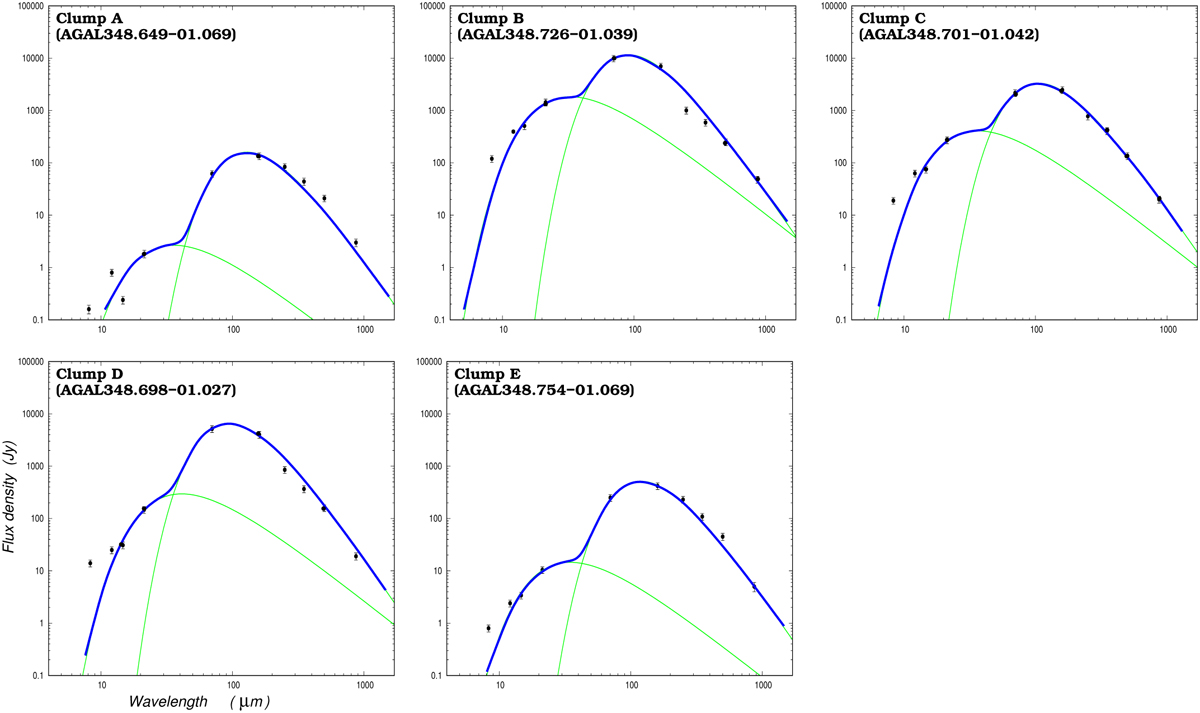
Fig. 11
Download original image
Spectral energy distributions derived for clumps A to E using a two-component black-body and grey-body model (green lines). The blue lines represent the total SED. The plots are on a logarithmic scale.
Current usage metrics show cumulative count of Article Views (full-text article views including HTML views, PDF and ePub downloads, according to the available data) and Abstracts Views on Vision4Press platform.
Data correspond to usage on the plateform after 2015. The current usage metrics is available 48-96 hours after online publication and is updated daily on week days.
Initial download of the metrics may take a while.