Fig. 10
Download original image
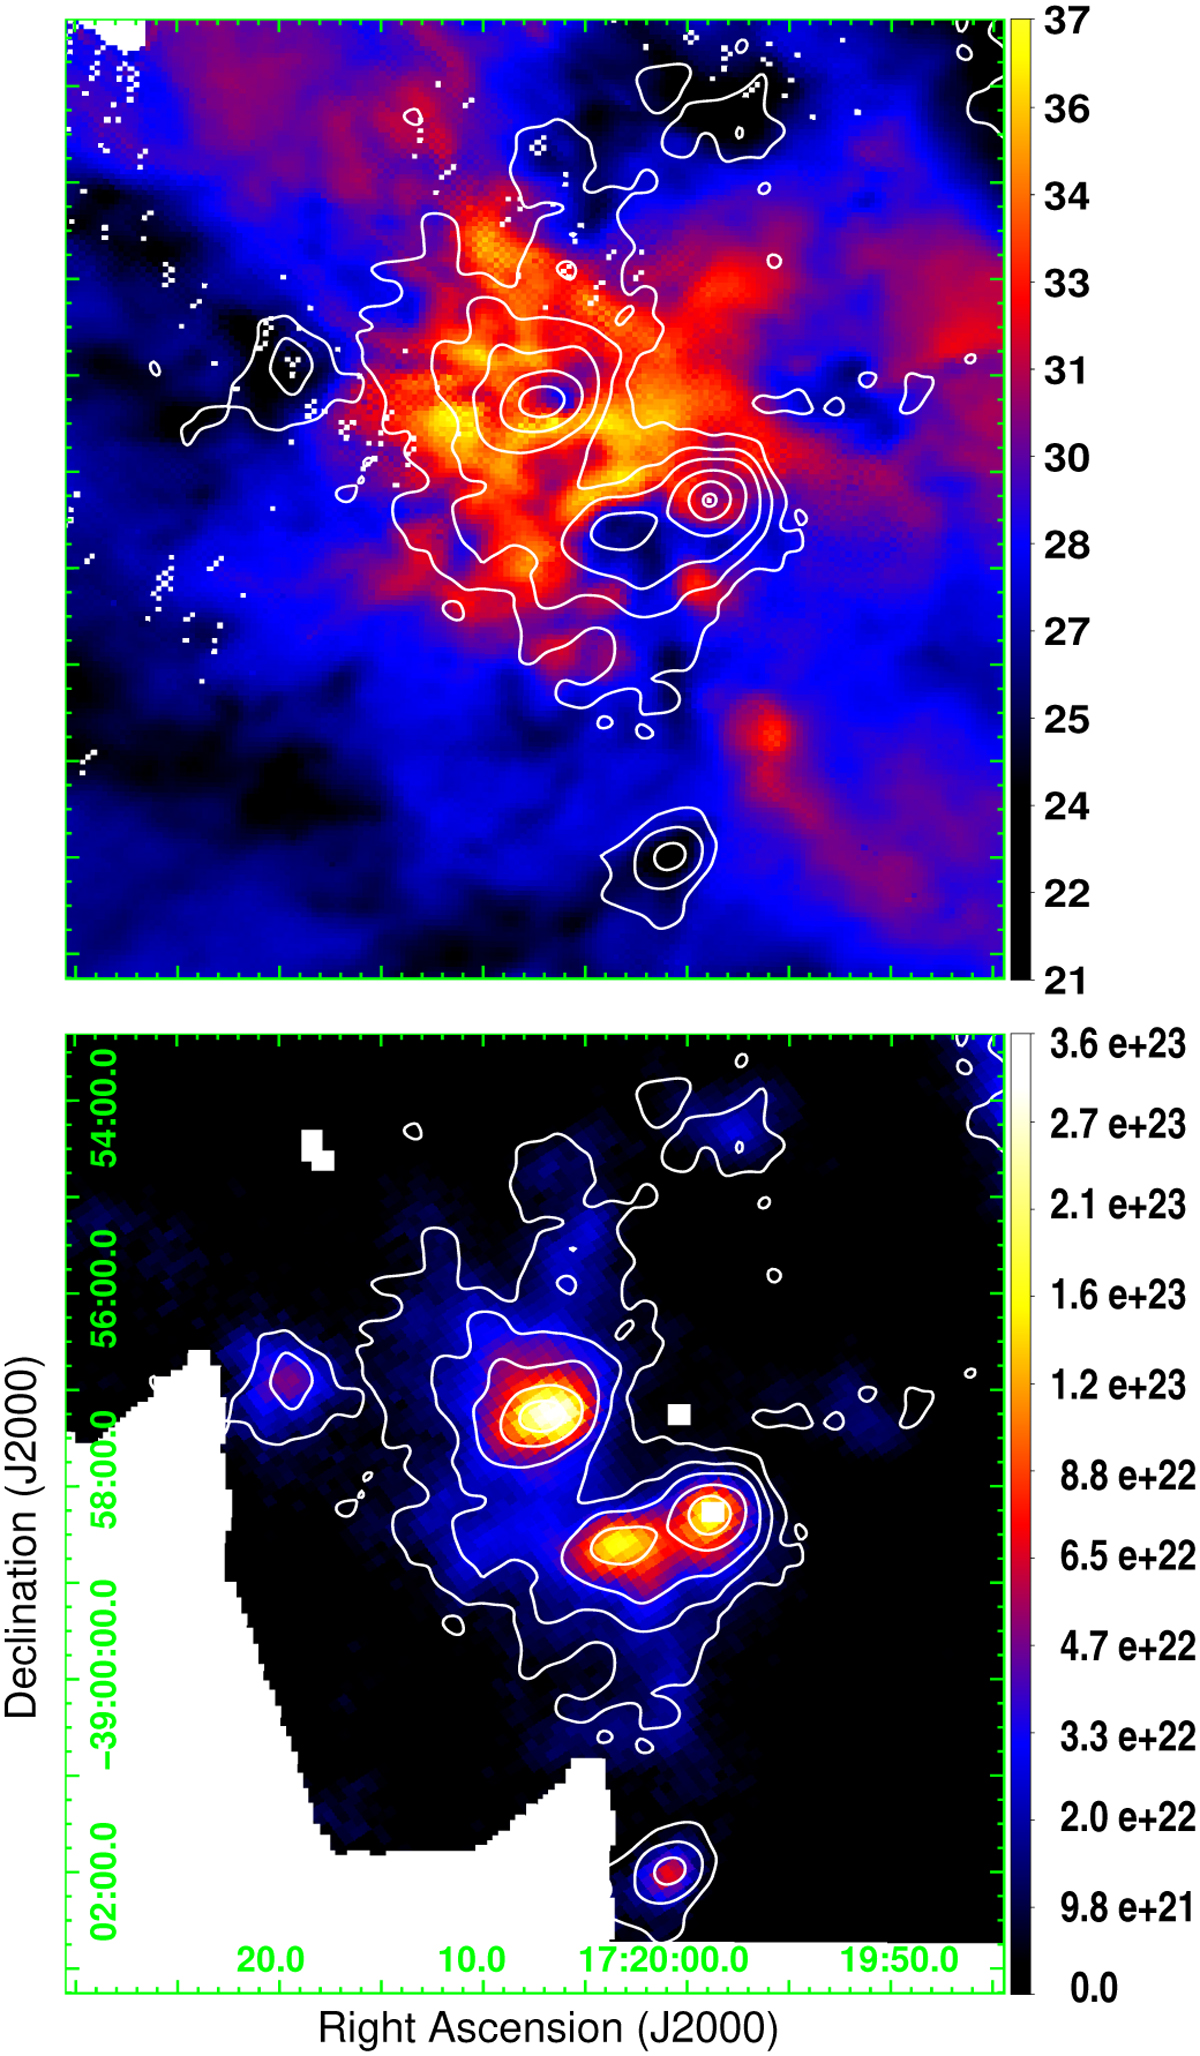
Dust color temperature (K) map derived from the 70 and 160 µm emissions (upper panel) and column density (cm−2) map derived from the 870 µm map emission (lower panel). White contours underline the HCO+(4−3) emission map as presented in Fig. 3. The color temperature and column density color bar scales are on the right, expressed in K and cm−2, respectively.
Current usage metrics show cumulative count of Article Views (full-text article views including HTML views, PDF and ePub downloads, according to the available data) and Abstracts Views on Vision4Press platform.
Data correspond to usage on the plateform after 2015. The current usage metrics is available 48-96 hours after online publication and is updated daily on week days.
Initial download of the metrics may take a while.