Fig. 1
Download original image
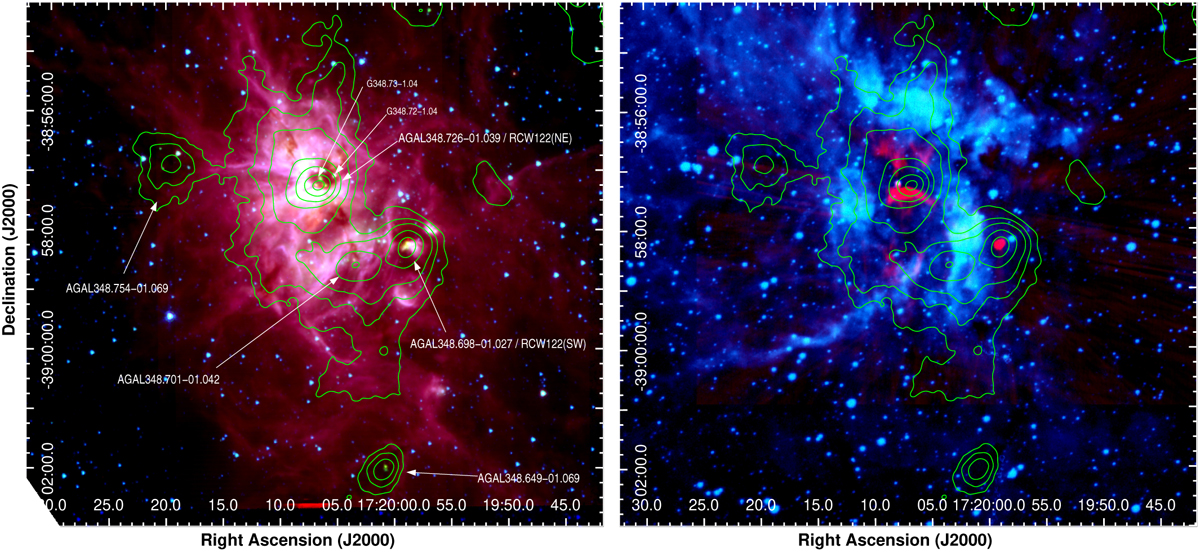
Studied region of RCW 122. Left panel: composite images in red, green, and blue colors show emission at 8.0, 4.5, and 3.6 µm (Spitɀer/IRAC), respectively. Green contours represent the 870 µm dust continuum emission from the ATLASGAL survey, with levels of 0.6 (~8 r ms), 1.2, 2.3, 4.8, 8, and 15 Jy beam−1. White arrows and labels indicate the position of ATLASGAL clumps identified by Contreras et al. (2013) and the HC3N spots reported by Sollins & Megeath (2004) (see text). Right panel: SuperCosmos Hα emission image (blue color) superimposed on the VLASS radio continuum image at 3 GHz (red color). As presented in the left panel, the green contours represent the 870 µm emission.
Current usage metrics show cumulative count of Article Views (full-text article views including HTML views, PDF and ePub downloads, according to the available data) and Abstracts Views on Vision4Press platform.
Data correspond to usage on the plateform after 2015. The current usage metrics is available 48-96 hours after online publication and is updated daily on week days.
Initial download of the metrics may take a while.