Fig. 9.
Download original image
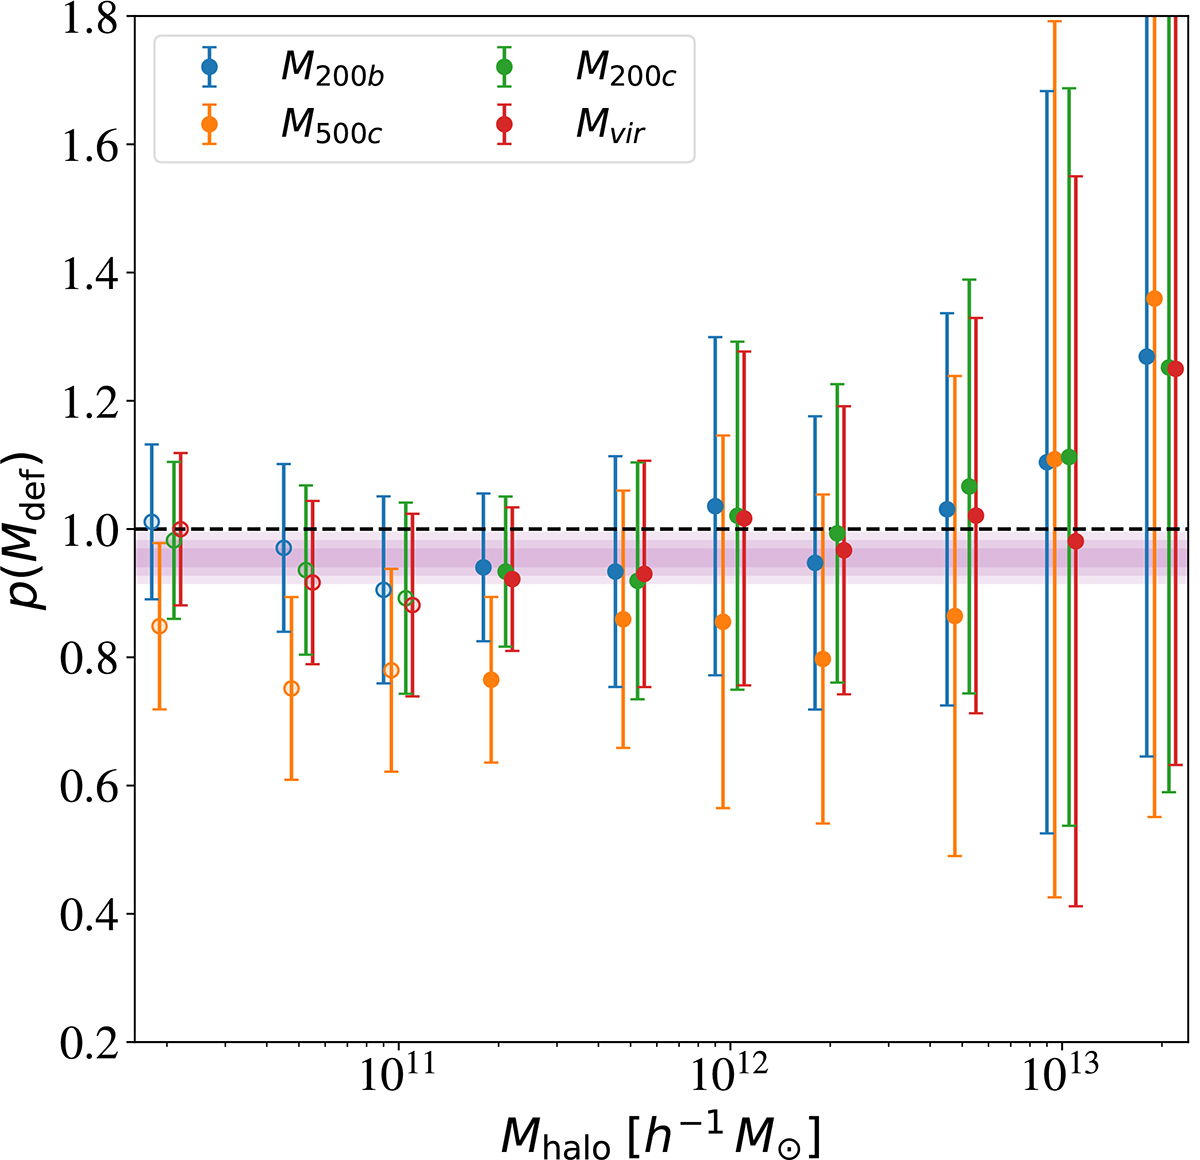
PNG bias parameter p as a function of Mhalo for different mass definitions. The green symbols represent our choice for the fiducial analysis (M200c), while the grey dashed line represents the universality relation (p = 1). The shaded areas represent the 1σ, 2σ and the 3σ regions (from darker to lighter respectively) around the value of p we find in Eq. (19). Masses are shifted for visualisation purposes.
Current usage metrics show cumulative count of Article Views (full-text article views including HTML views, PDF and ePub downloads, according to the available data) and Abstracts Views on Vision4Press platform.
Data correspond to usage on the plateform after 2015. The current usage metrics is available 48-96 hours after online publication and is updated daily on week days.
Initial download of the metrics may take a while.