Fig. 8.
Download original image
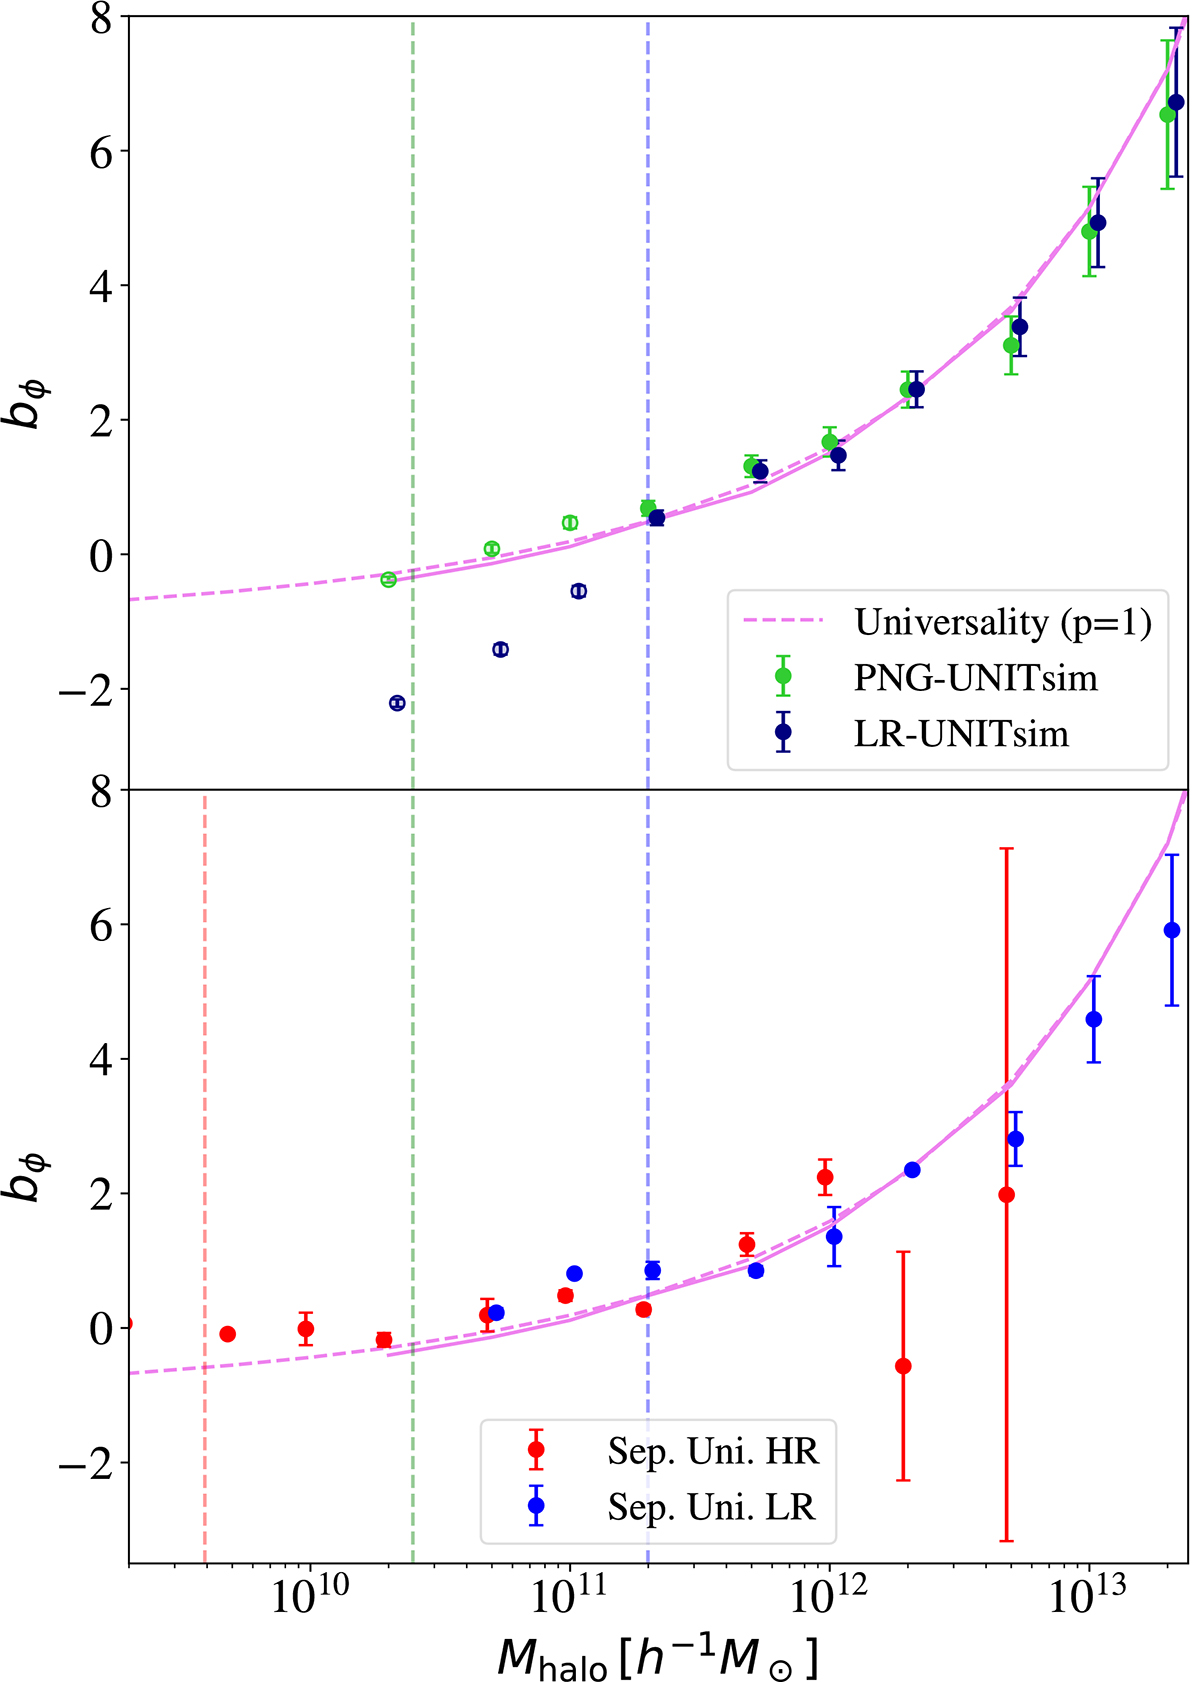
Non-Gaussian bias parameter bϕ as a function of the halo mass for the different sets of simulations. The colour of the symbols and the dashed lines represent the mass resolution. Red: mp = 1.5 × 10⁸ [h−1 M⊙]. Green: mp = 1.2 × 10⁹ [h−1 M⊙]. Blue-Dark blue: mp = 1.0 × 10¹⁰ [h−1 M⊙]. The dashed vertical lines represent the threshold of Mhalo = 20mpart for each simulation. The pink solid line is the universality relation p = 1 for the b1 values measured in the PNG-UNIT. The dashed pink line extrapolates the universality relation toward lower masses, using b1 coming from Tinker et al. (2010). In solid circles, we use the best fit to Eq. (15) for estimating the power spectrum variance; in rings, we use the extrapolation method. Upper panel: measurements of bϕ in non-Gaussian simulations by fitting Eq. (11) (see Sect. 6.1). Lower panel: measurements of bϕ using the separate universe technique (see Sect. 6.2).
Current usage metrics show cumulative count of Article Views (full-text article views including HTML views, PDF and ePub downloads, according to the available data) and Abstracts Views on Vision4Press platform.
Data correspond to usage on the plateform after 2015. The current usage metrics is available 48-96 hours after online publication and is updated daily on week days.
Initial download of the metrics may take a while.