Fig. 7.
Download original image
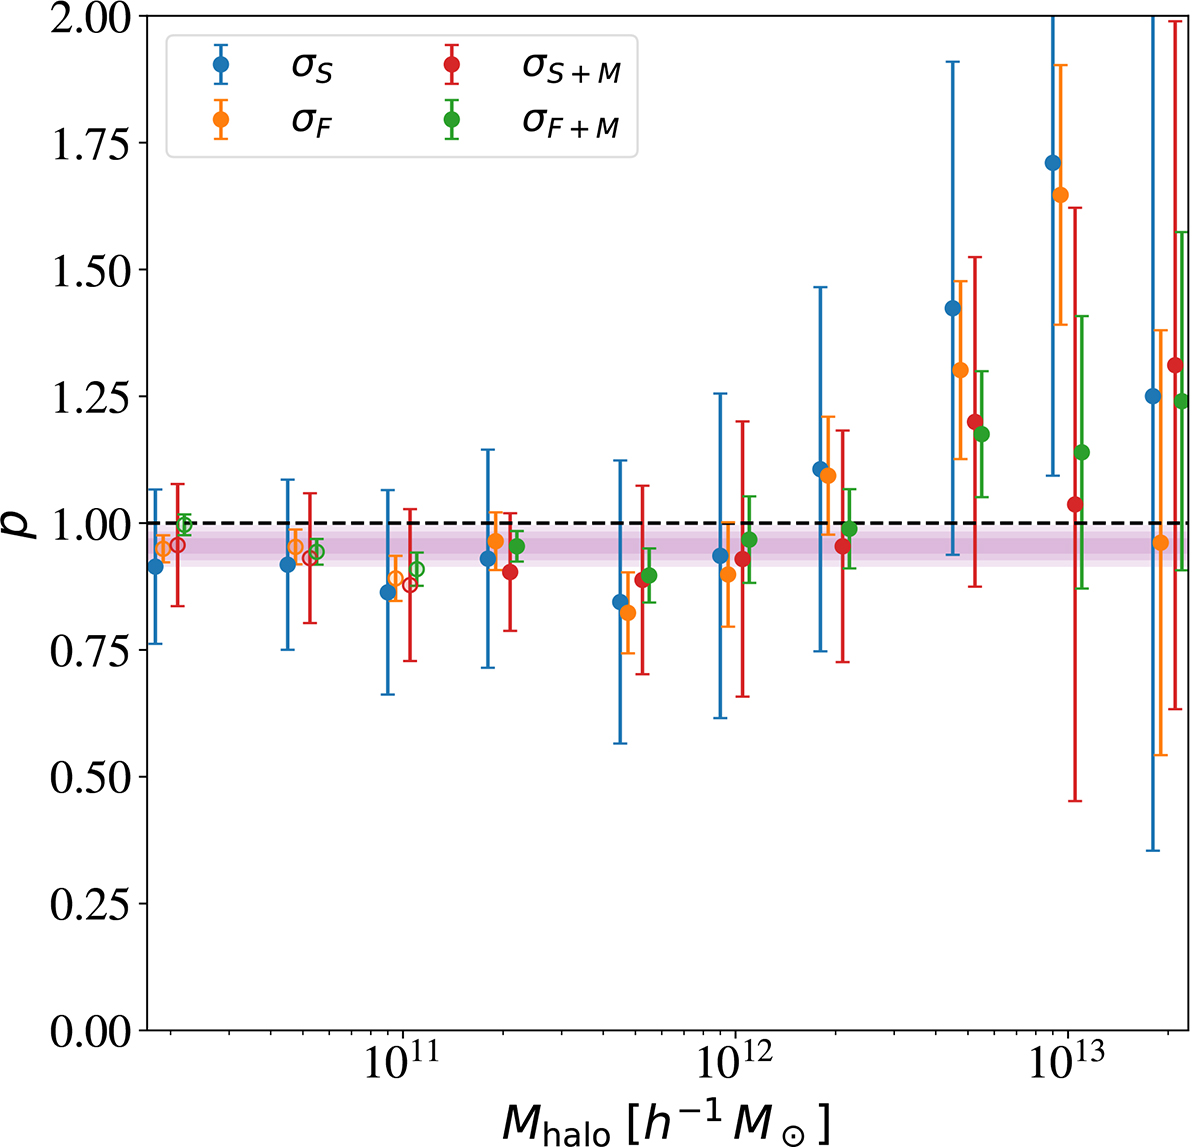
PNG-response parameter p as a function of the halo mass, using different methods to treat variances. Blue and orange symbols show results for the non-Gaussian simulation, using standard variances (Eq. (14)) and fixed variances, respectively. Green and red symbols show the same after applying the matching with the Gaussian simulation. In solid circles, the fixed variances is estimated by the best fit to the FASTPM variances with Eq. (15); in rings, we use the extrapolation method. The shaded areas represent the 1σ, 2σ and the 3σ regions (from darker to lighter respectively) around the value of p we find in Eq. (19).
Current usage metrics show cumulative count of Article Views (full-text article views including HTML views, PDF and ePub downloads, according to the available data) and Abstracts Views on Vision4Press platform.
Data correspond to usage on the plateform after 2015. The current usage metrics is available 48-96 hours after online publication and is updated daily on week days.
Initial download of the metrics may take a while.