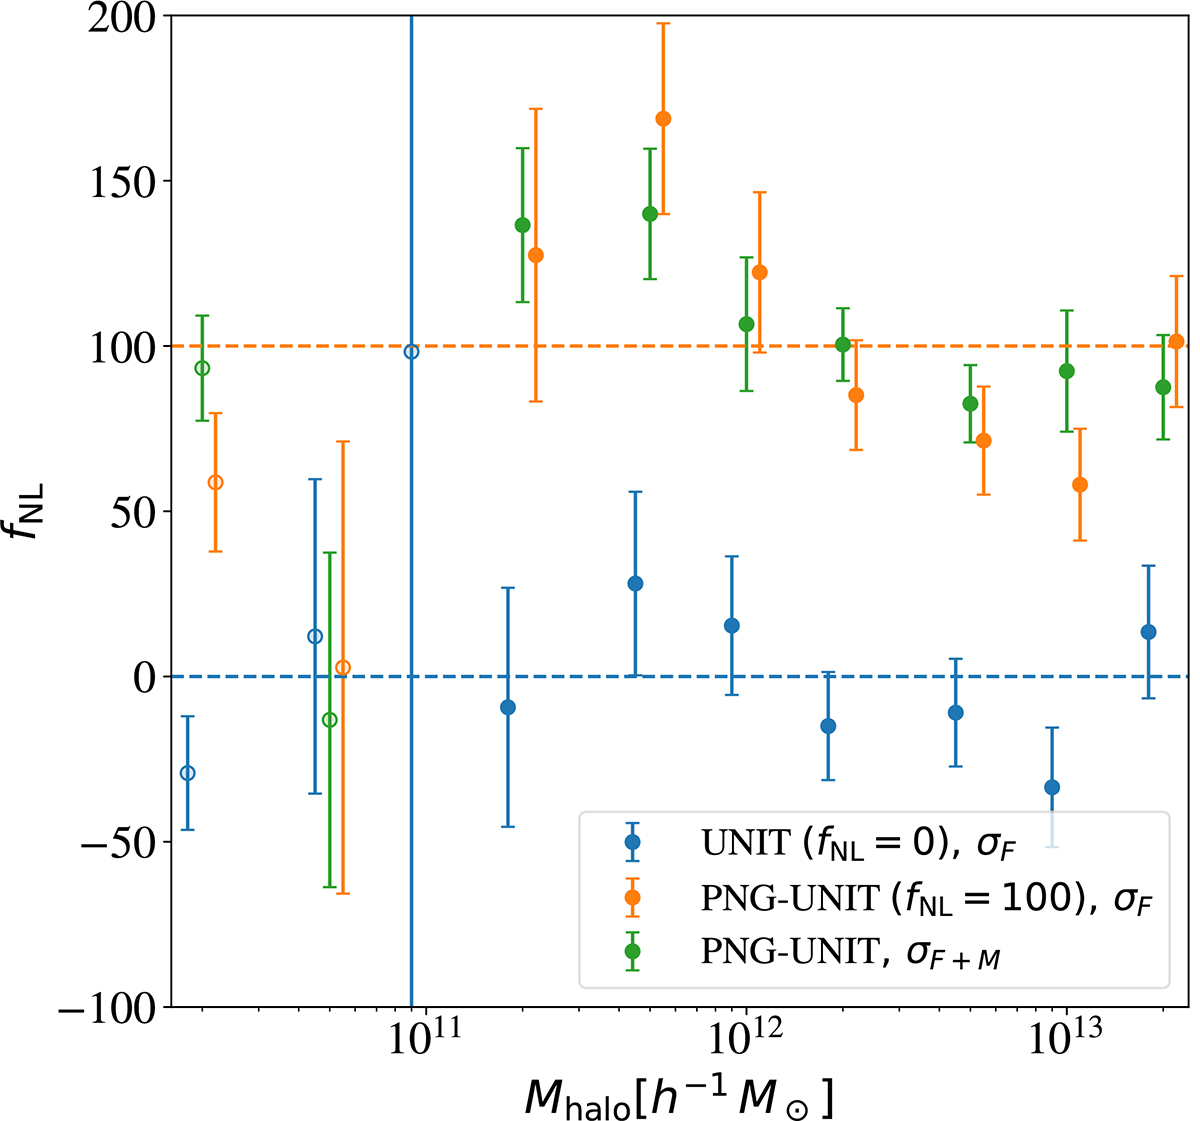
Fig. 6.
Download original image
Value of fNL for each mass bin, assuming bϕ is described by Eq. (13) with p = 1. Blue and orange symbols show results for the Gaussian and non-Gaussian simulations, respectively. In contrast, green symbols show the matching (difference) between them, where we used Eq. (16) for obtaining bϕfNL and Eq. (17) for its uncertainty. Dashed lines show the input fNL values for each simulation. For the mass bins 2 and 3, we have that b1 − 1 ≤ 0.1 and hence bϕ ∼ 0. This value of bϕ explains the large error bars compared to the other mass bins. In solid circles, we use the best fit to Eq. (15) for estimating the power spectrum variance; in rings, we use the extrapolation method.
Current usage metrics show cumulative count of Article Views (full-text article views including HTML views, PDF and ePub downloads, according to the available data) and Abstracts Views on Vision4Press platform.
Data correspond to usage on the plateform after 2015. The current usage metrics is available 48-96 hours after online publication and is updated daily on week days.
Initial download of the metrics may take a while.