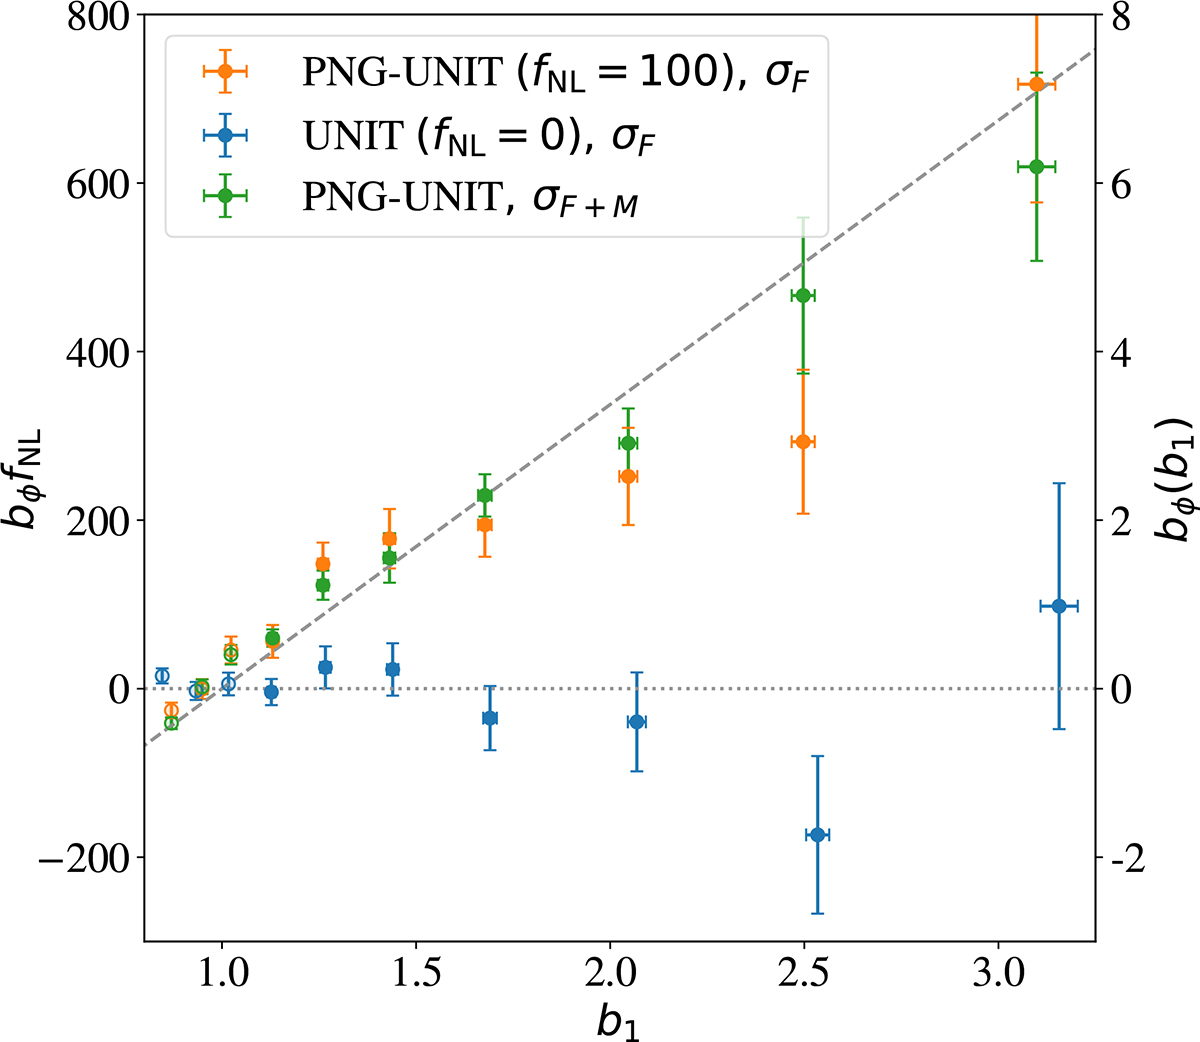
Fig. 5.
Download original image
Constraints on bϕfNL as a function of b1. Blue and orange symbols show results for the Gaussian and the non-Gaussian simulations, respectively, assuming that the P(k) variance is computed from the FASTPM mocks (see Sect. 4.2). By subtracting both, we obtain the green points. Thanks to the so-called matching technique, these points have smaller uncertainties (see Eqs. (16) and (17) in Sect. 4.3). Grey lines indicate the expected value by assuming the universality relation, with the dotted line for fNL = 0 and the dashed line for fNL = 100. In solid circles, we use the best fit to Eq. (15) for estimating the power spectrum variance; in rings, we use the extrapolation method. Here, mass bins 0–9 are shown.
Current usage metrics show cumulative count of Article Views (full-text article views including HTML views, PDF and ePub downloads, according to the available data) and Abstracts Views on Vision4Press platform.
Data correspond to usage on the plateform after 2015. The current usage metrics is available 48-96 hours after online publication and is updated daily on week days.
Initial download of the metrics may take a while.