Fig. 4.
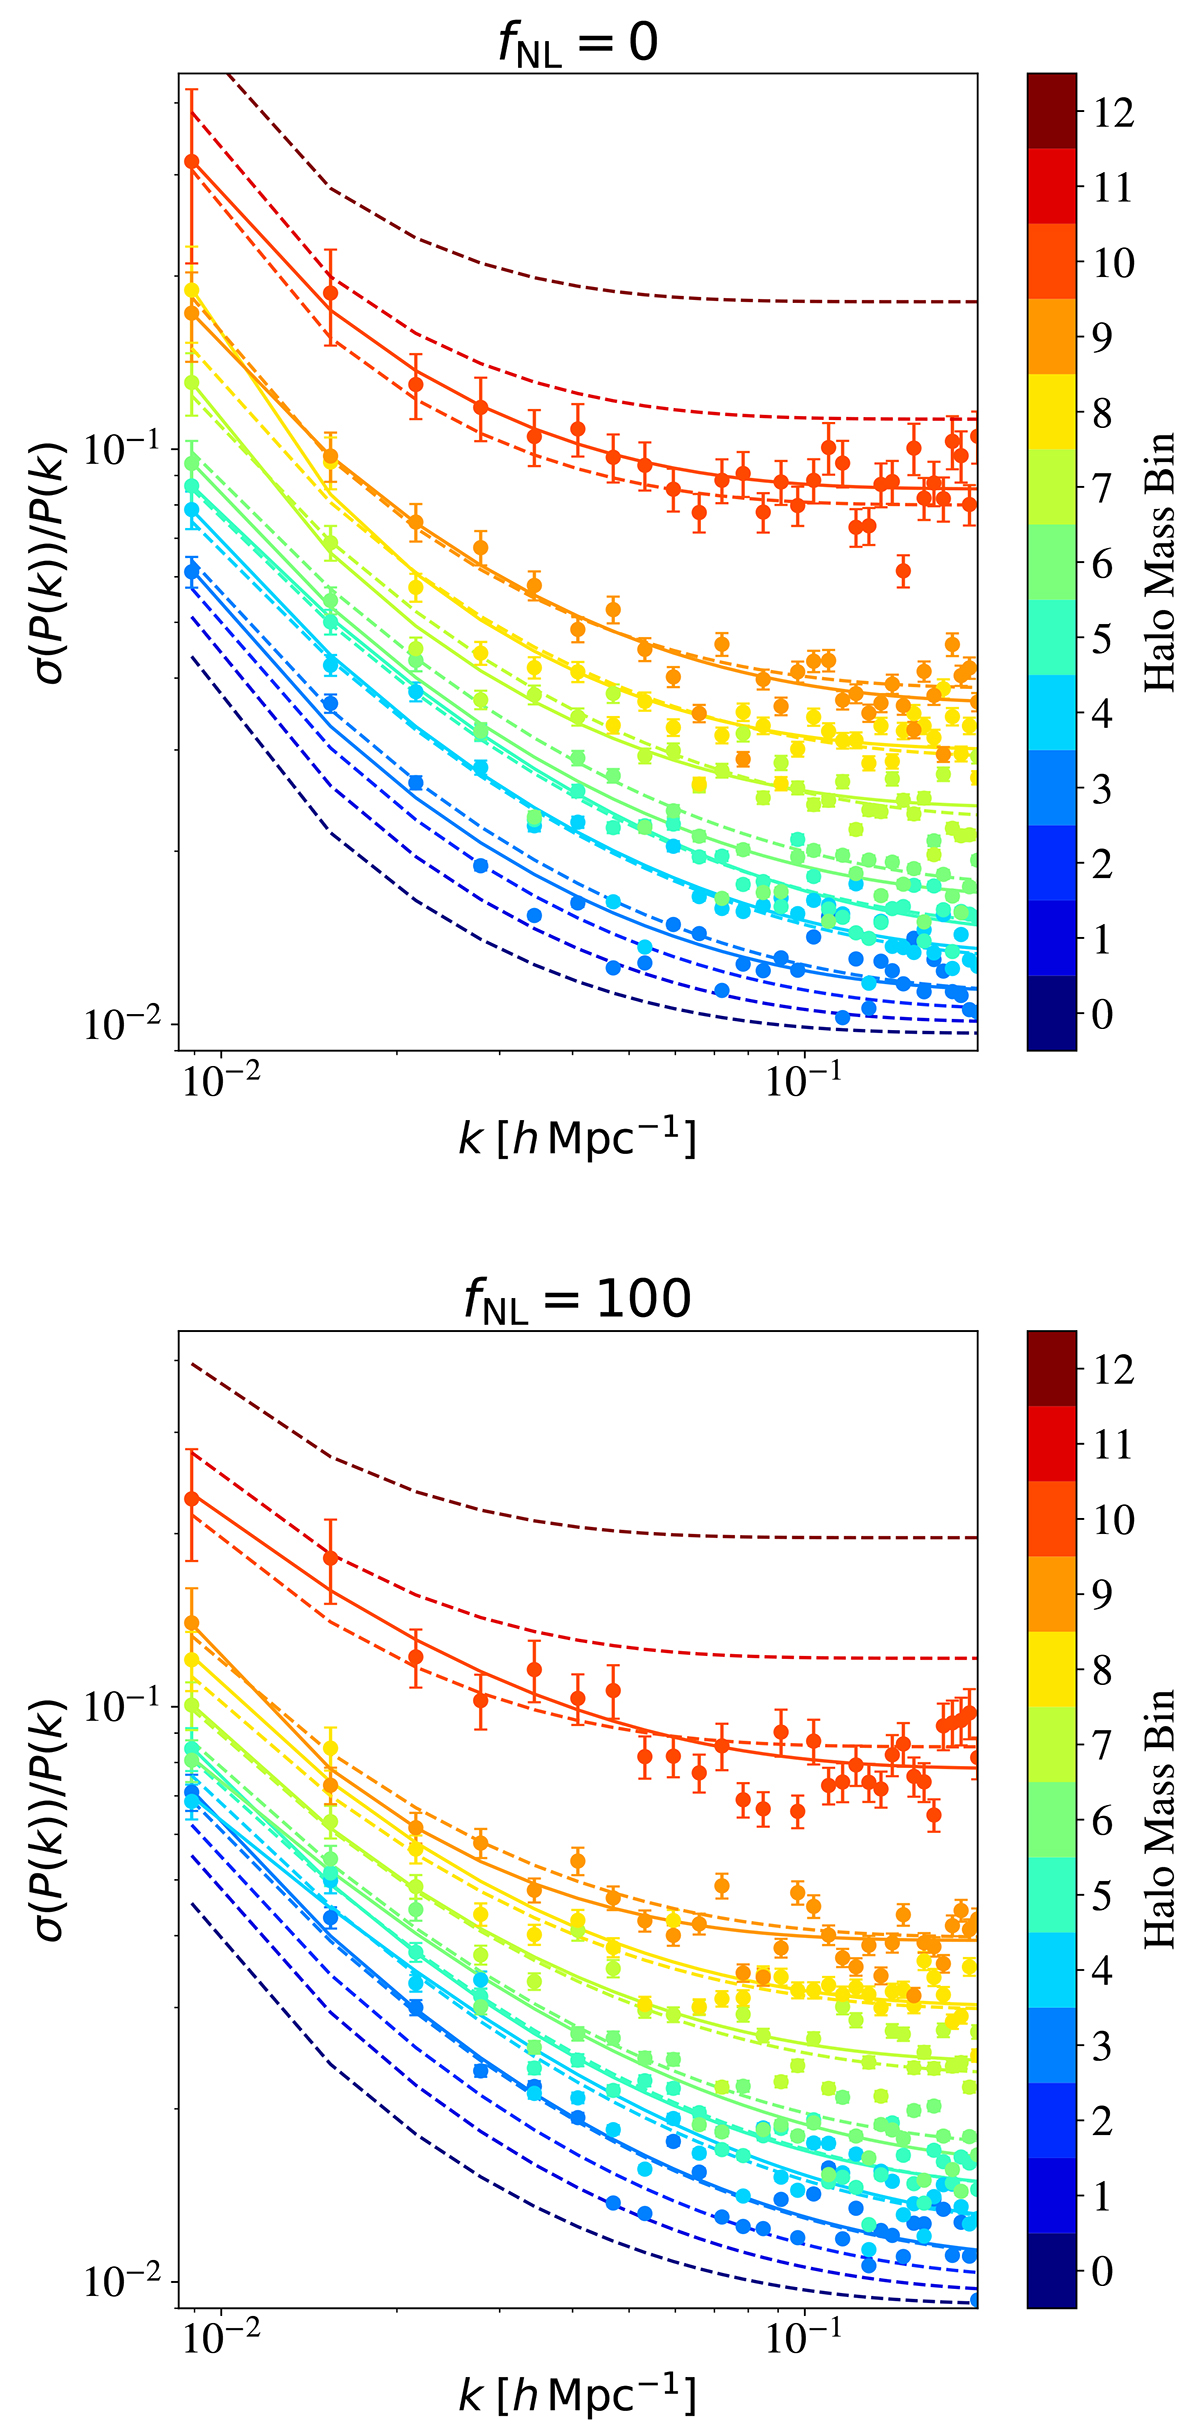
Download original image
Variance over mean power spectrum for each halo mass bin (indicated by colour with the mass ranges defined in Table 3). Markers with error bars show the data taken directly from the FASTPM mocks, while solid lines show results obtained by fitting these curves to Eq. (15). The extrapolation to each mass bin as described in Sect. 4.2 is shown in dashed lines.
Current usage metrics show cumulative count of Article Views (full-text article views including HTML views, PDF and ePub downloads, according to the available data) and Abstracts Views on Vision4Press platform.
Data correspond to usage on the plateform after 2015. The current usage metrics is available 48-96 hours after online publication and is updated daily on week days.
Initial download of the metrics may take a while.