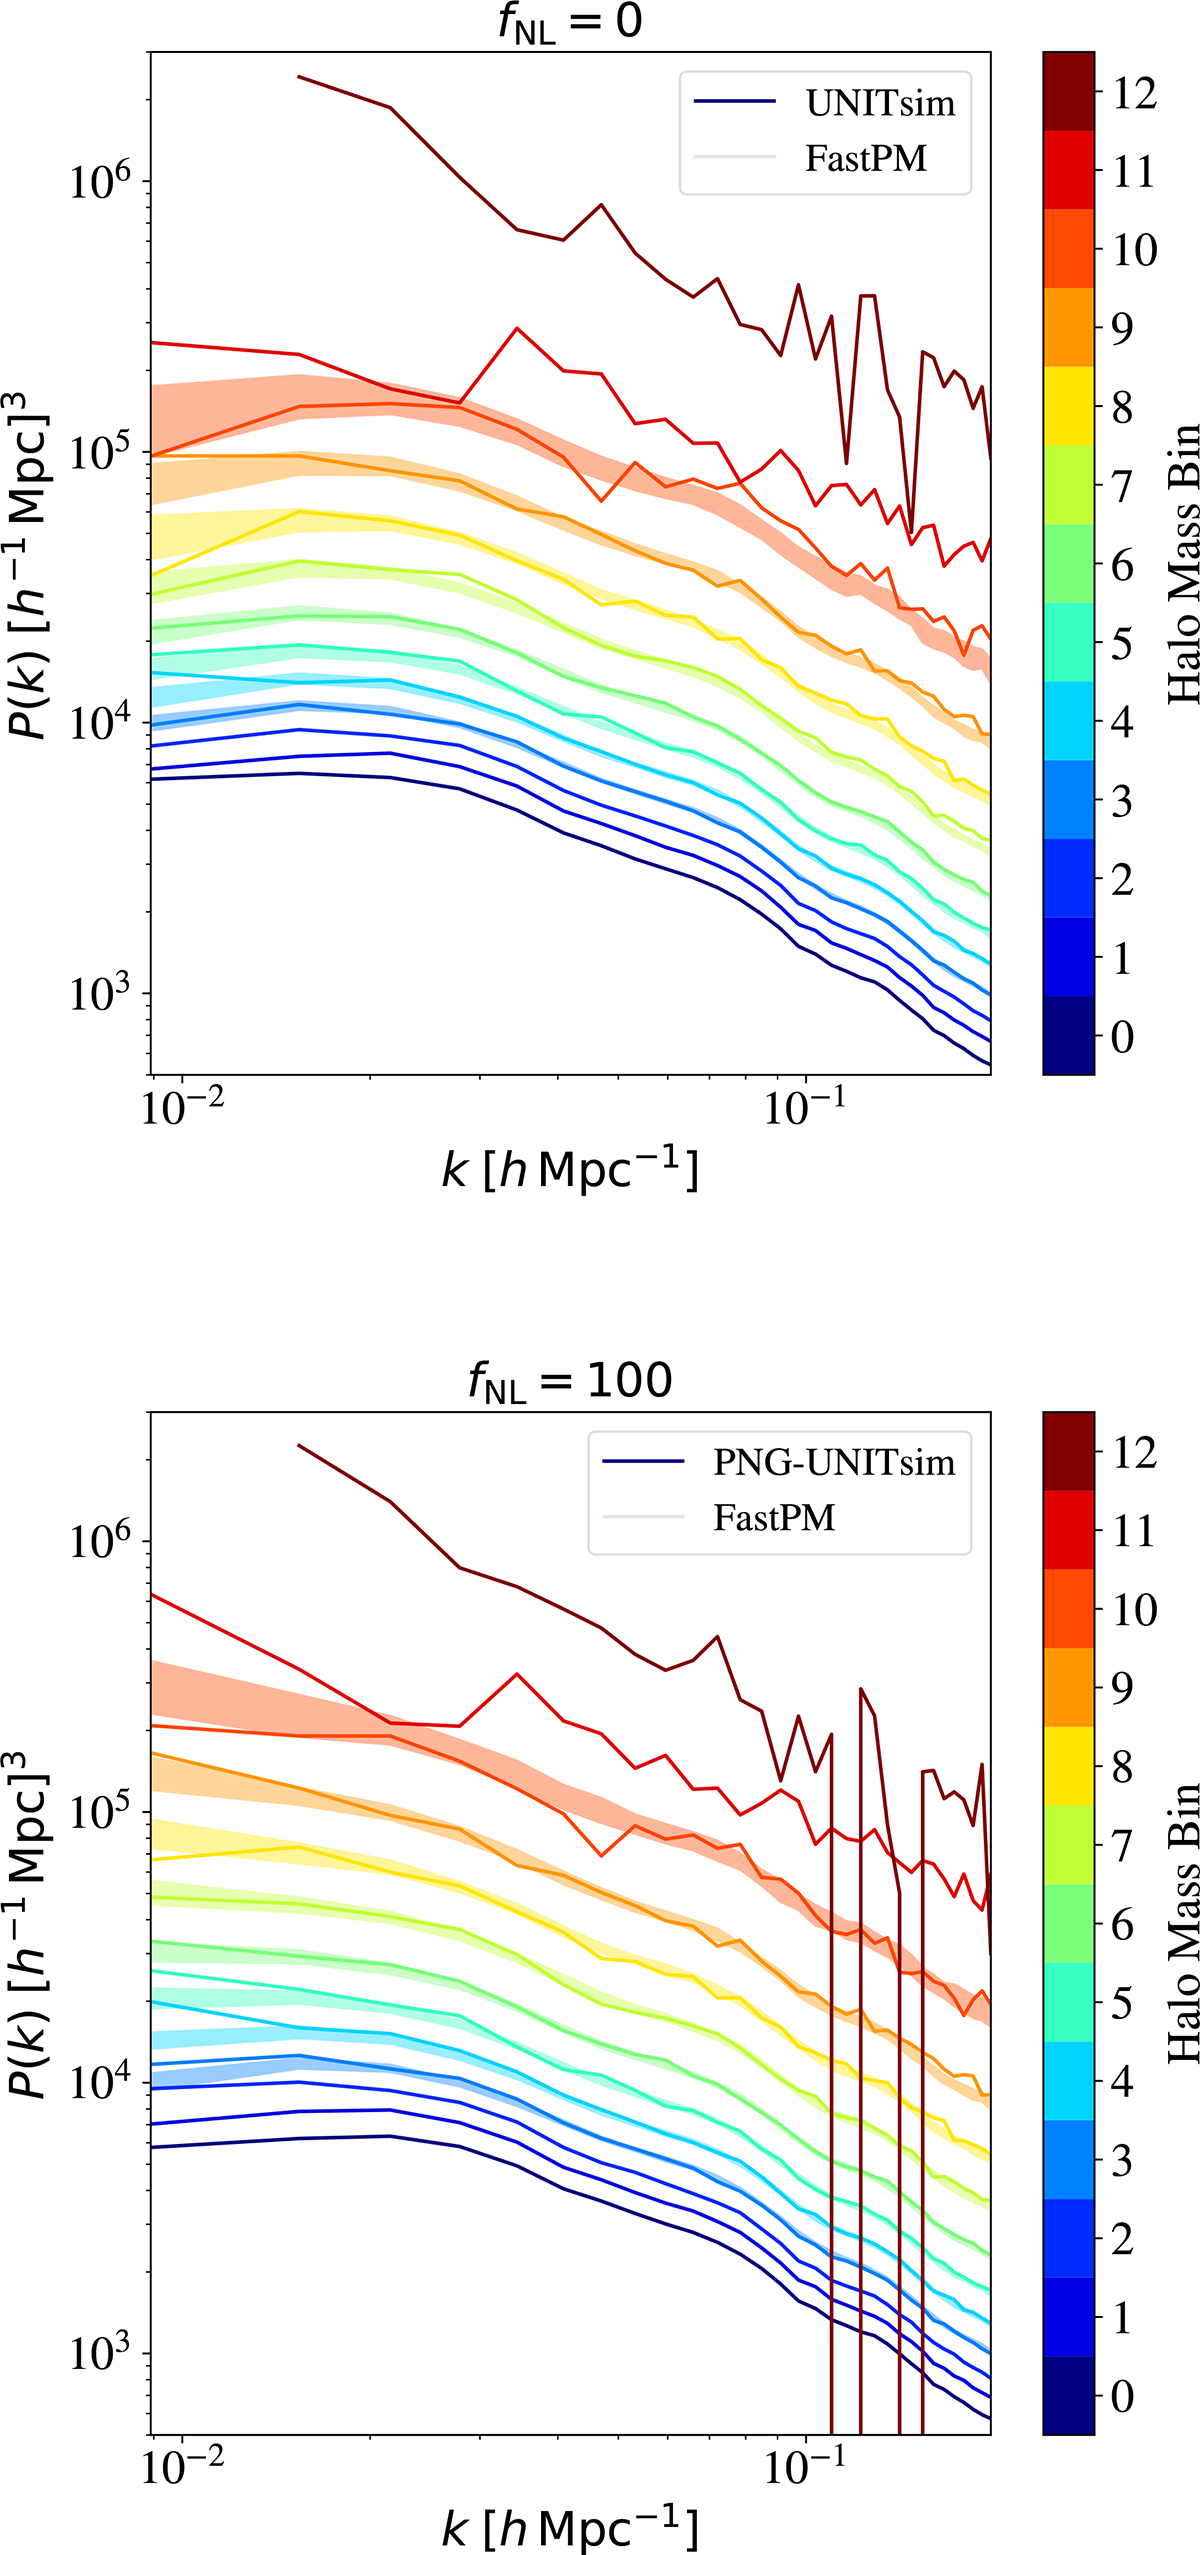
Fig. 3.
Download original image
Solid lines represent the power spectrum of PNG-UNIT halos within the different halo mass bins (see Table 3 for the mass ranges). Shaded regions show the standard deviation around the mean power spectrum of the FASTPM mocks, generated using halos in mass bins that reproduce the clustering and the abundance of the N-body simulation (see Sect. 4.1). There are no halos in the two lowest-mass bins (1 and 2, shown in dark blues) in the FASTPM mocks since the mass resolution is not high enough to resolve them. The top panel shows the fNL = 0 case, and the bottom panel shows the fNL = 100 one.
Current usage metrics show cumulative count of Article Views (full-text article views including HTML views, PDF and ePub downloads, according to the available data) and Abstracts Views on Vision4Press platform.
Data correspond to usage on the plateform after 2015. The current usage metrics is available 48-96 hours after online publication and is updated daily on week days.
Initial download of the metrics may take a while.