Fig. 11.
Download original image
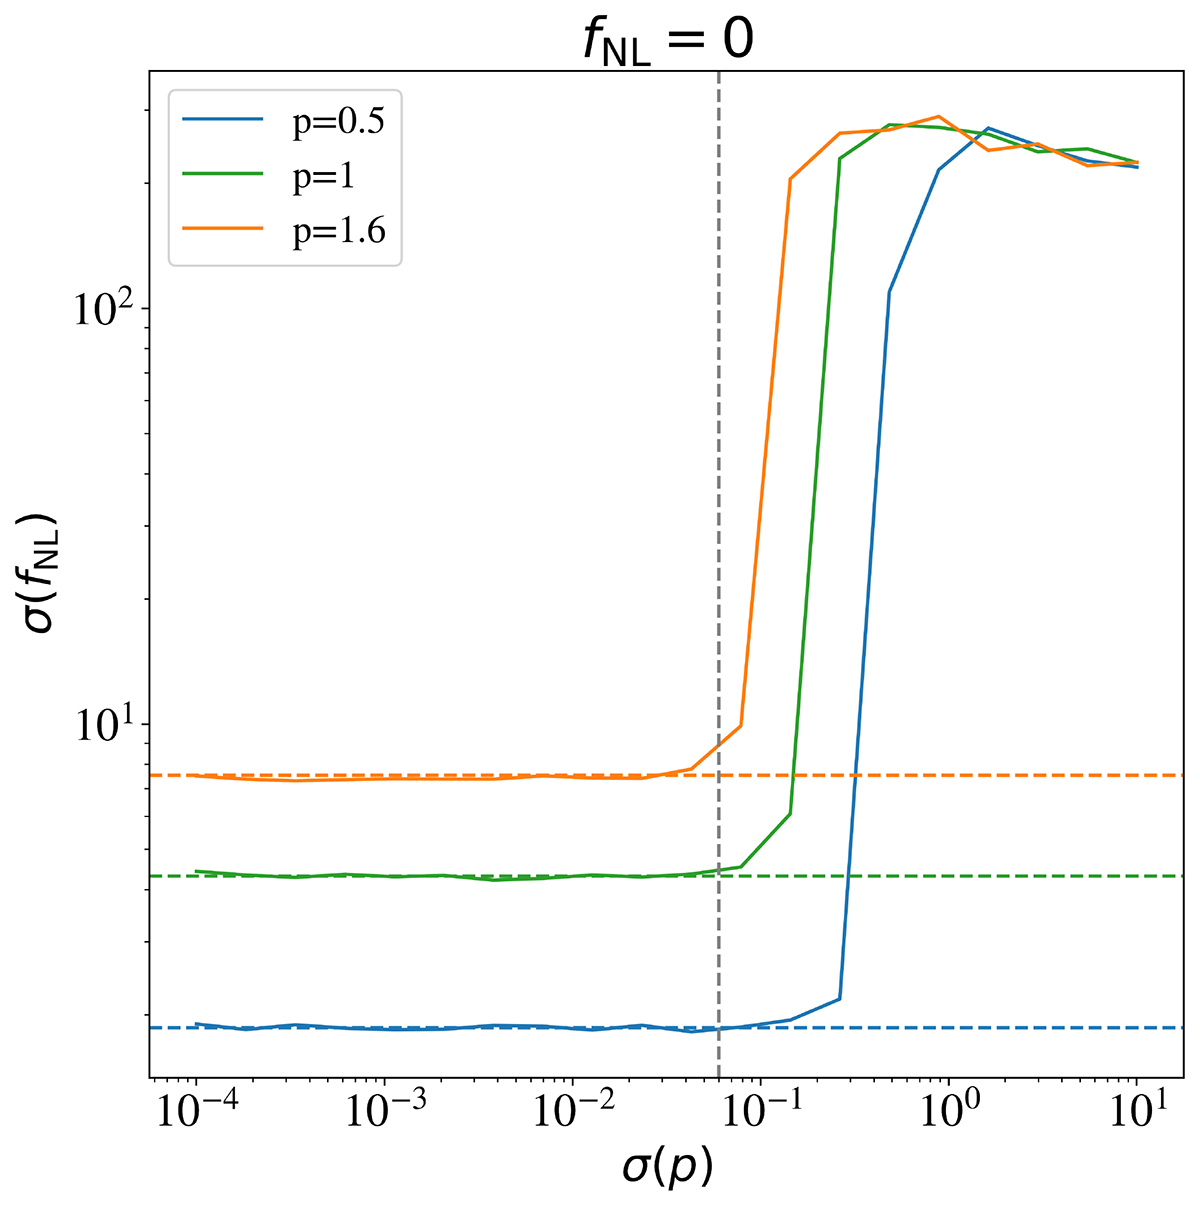
Statistical error in fNL as a function of the size of the prior on p, for three values for p, shown in different colours, as indicated in the legend. The mock data vector for this figure is generated using the linear power spectrum computed with CAMB in Eq. (11) and fixing b1 = 1.4 and fNL, fid = 0. The horizontal dashed lines show the case where we performed the fits fixing p in the model to its corresponding fiducial value. The dashed vertical line displays the value of the error in p, obtained for halos with mass between 5 × 10¹¹ and 1 × 10¹² h−1 M⊙ (bin 4 in Table 3).
Current usage metrics show cumulative count of Article Views (full-text article views including HTML views, PDF and ePub downloads, according to the available data) and Abstracts Views on Vision4Press platform.
Data correspond to usage on the plateform after 2015. The current usage metrics is available 48-96 hours after online publication and is updated daily on week days.
Initial download of the metrics may take a while.