Fig. 10.
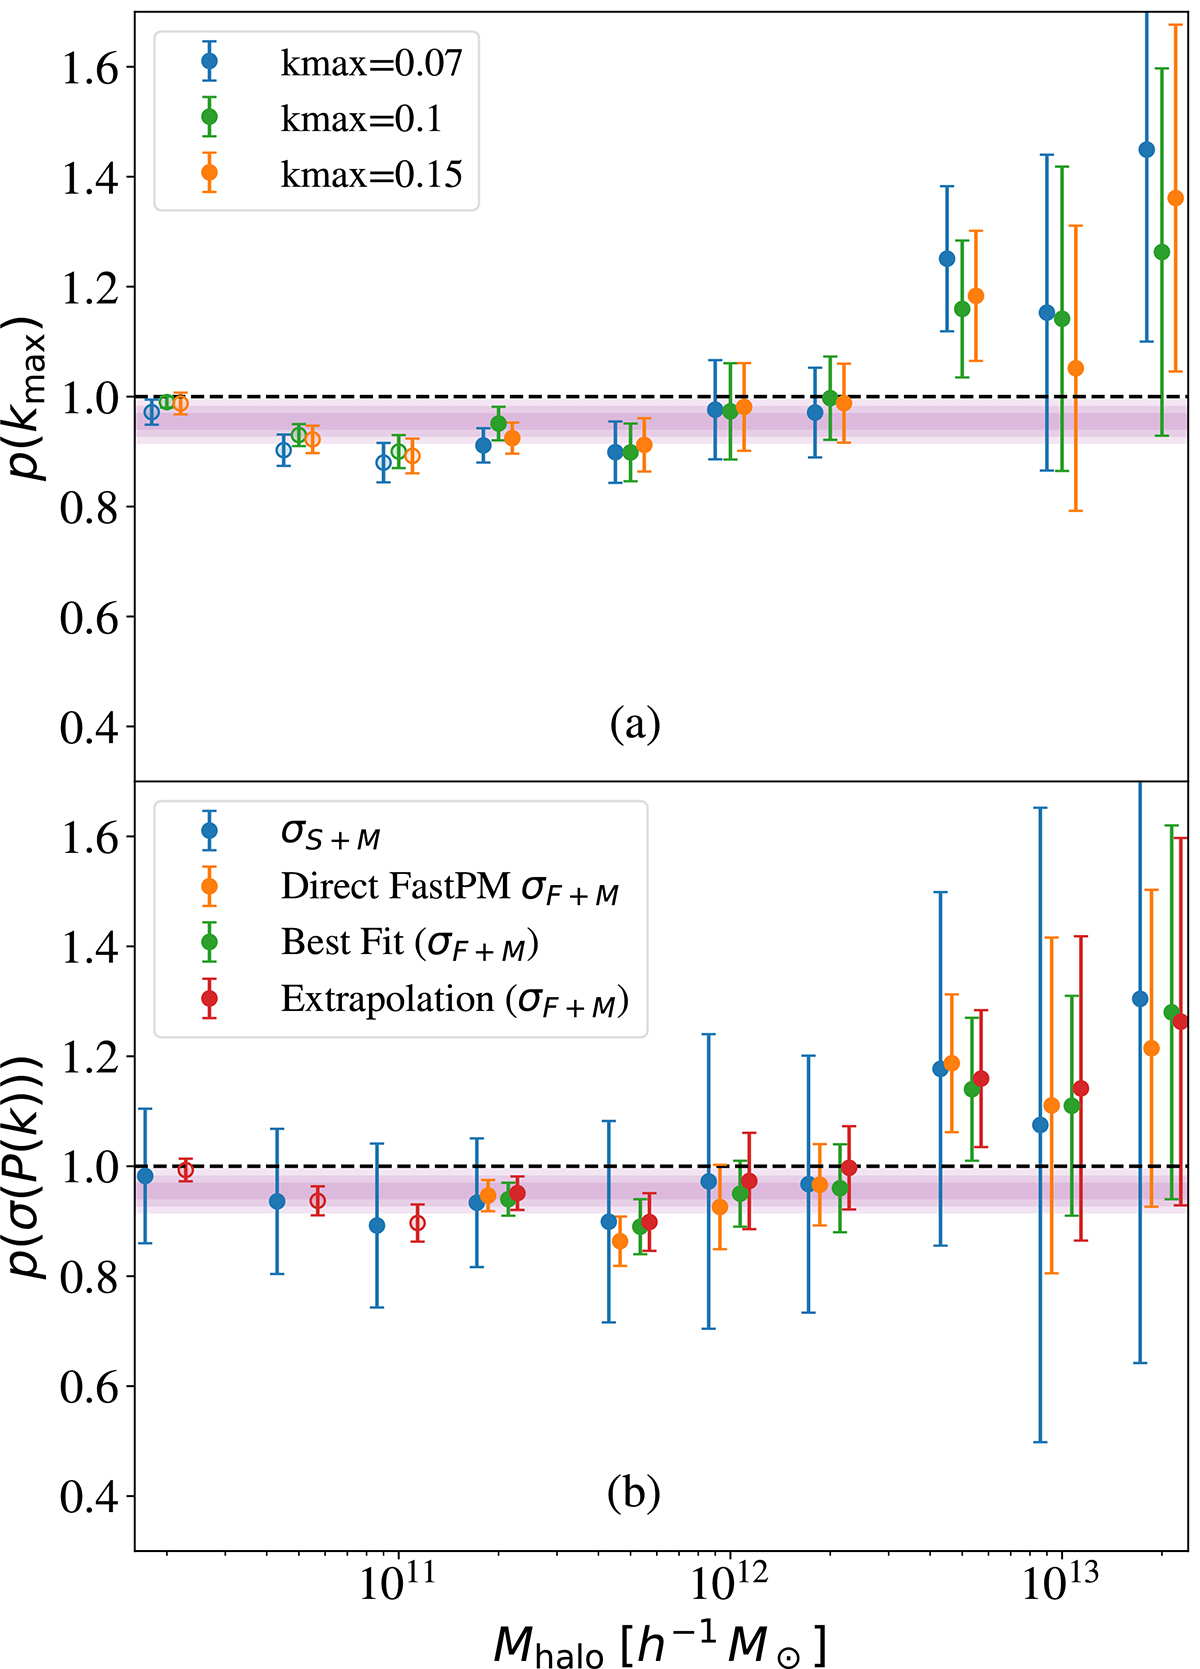
Download original image
PNG bias parameter p as a function of Mhalo for different analysis choices. The green symbols represent the fiducial choices, while the grey dashed line represents the universality relation (p = 1). In solid circles, we use the best fit to Eq. (15) for estimating the power spectrum variance; in rings, we use the extrapolation method. The shaded areas represent the 1σ, 2σ and the 3σ regions (from darker to lighter respectively) around the value of p we find in Eq. (19). Masses are shifted for visualisation purposes. Panel a: variation in p with changes kmax (see Sect. 7.1). Panel b: constraints on p by considering different methods to compute σ(P(k)), namely: standard σS(P(k)) (blue), direct fit to FASTPM mocks (orange), best-fit to Eq. (15) (green) and extrapolation of Eq. (15) to the mass bins (red) (see Sect. 7.2).
Current usage metrics show cumulative count of Article Views (full-text article views including HTML views, PDF and ePub downloads, according to the available data) and Abstracts Views on Vision4Press platform.
Data correspond to usage on the plateform after 2015. The current usage metrics is available 48-96 hours after online publication and is updated daily on week days.
Initial download of the metrics may take a while.