Fig. 1.
Download original image
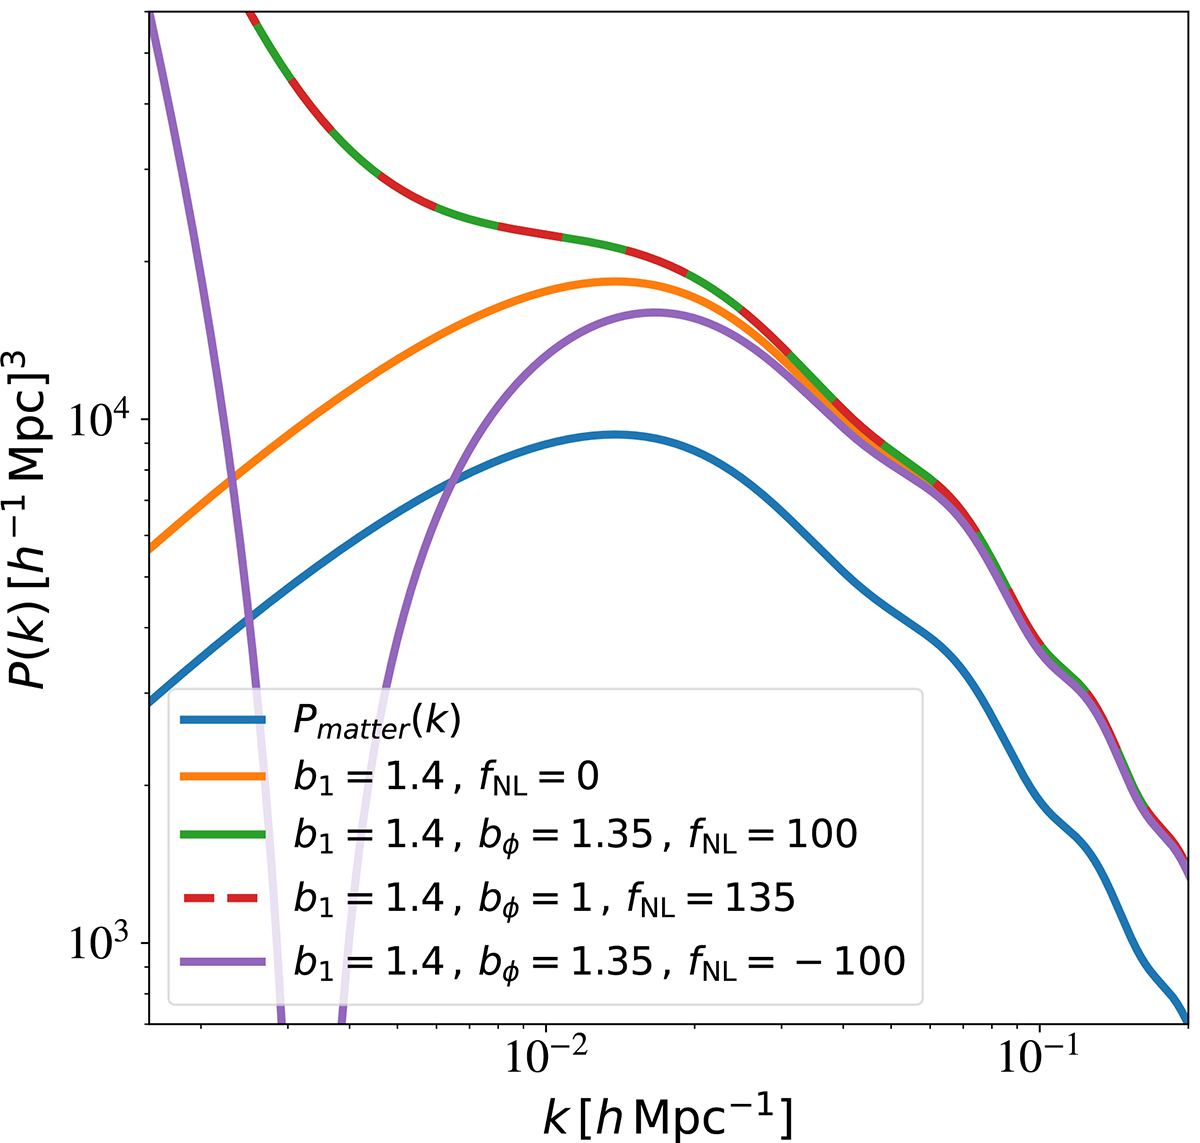
Theoretical power spectrum obtained from Eq. (11). The blue line shows the linear matter-matter power spectrum for the UNIT cosmology at z = 1. The b1 parameter is the same for all cases, and we chose it to be similar to the one expected for the DESI emission-line galaxies (ELGs) at that redshift (DESI Collaboration 2016). The orange line corresponds to the case of a biased tracer with Gaussian initial conditions. The green line shows the effect of a non-Gaussian contribution with fNL = 100 and a PNG-response parameter bϕ given by Eq. (13) with p = 1. The red line displays how a different value of fNL can lead to the same signal if the bϕ parameter does not follow the universality relation. Red and green lines are on top of each other since the product bϕfNL is the same. Finally, the purple line shows the kind of signal we expect in case bϕfNL < 0.
Current usage metrics show cumulative count of Article Views (full-text article views including HTML views, PDF and ePub downloads, according to the available data) and Abstracts Views on Vision4Press platform.
Data correspond to usage on the plateform after 2015. The current usage metrics is available 48-96 hours after online publication and is updated daily on week days.
Initial download of the metrics may take a while.