Fig. 7.
Download original image
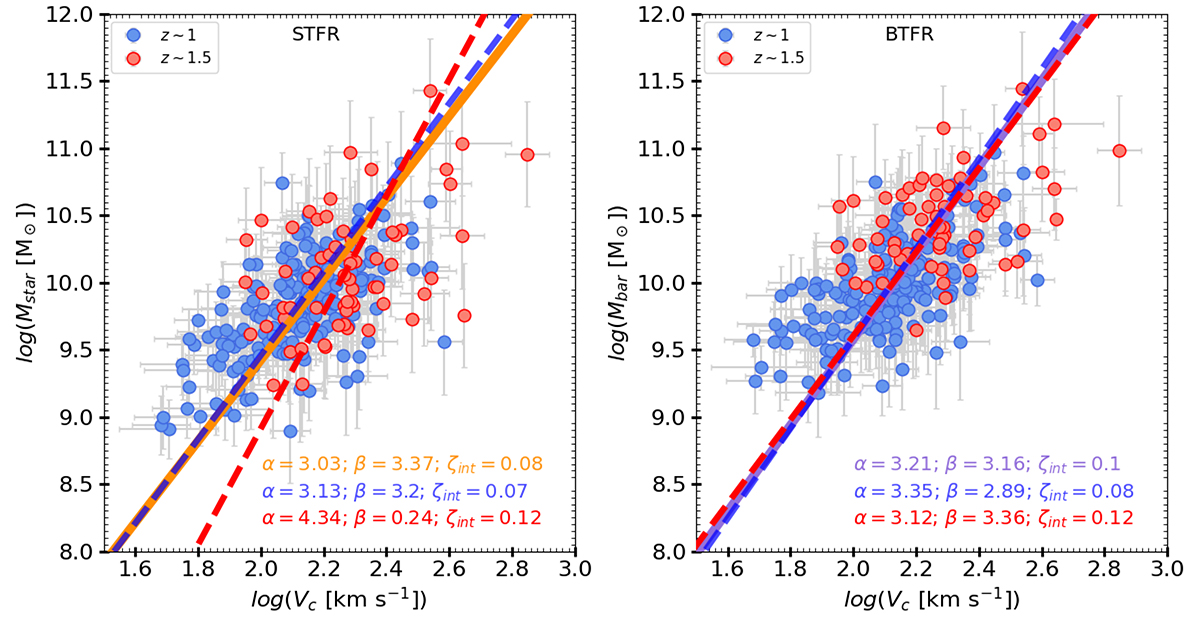
STFR and BTFR, respectively, separated into two redshift bins: 0.6 ≤ z ≤ 1.2 (![]() ) and 1.2 < z ≤ 2.3 (
) and 1.2 < z ≤ 2.3 (![]() ) presented in the left and right panels. The bins corresponding to z ∼ 1 and z ∼ 1.5 are shown in blue and red, respectively, and their respective fits are also displayed in red and blue colors. For reference, we have included the best-fits for STFR (in orange) and BTFR (in purple) derived from the full dataset. The associated best-fit parameters for each fit are provided at the bottom in their respective plots using the same color code as the best-fit lines.
) presented in the left and right panels. The bins corresponding to z ∼ 1 and z ∼ 1.5 are shown in blue and red, respectively, and their respective fits are also displayed in red and blue colors. For reference, we have included the best-fits for STFR (in orange) and BTFR (in purple) derived from the full dataset. The associated best-fit parameters for each fit are provided at the bottom in their respective plots using the same color code as the best-fit lines.
Current usage metrics show cumulative count of Article Views (full-text article views including HTML views, PDF and ePub downloads, according to the available data) and Abstracts Views on Vision4Press platform.
Data correspond to usage on the plateform after 2015. The current usage metrics is available 48-96 hours after online publication and is updated daily on week days.
Initial download of the metrics may take a while.