Fig. 10.
Download original image
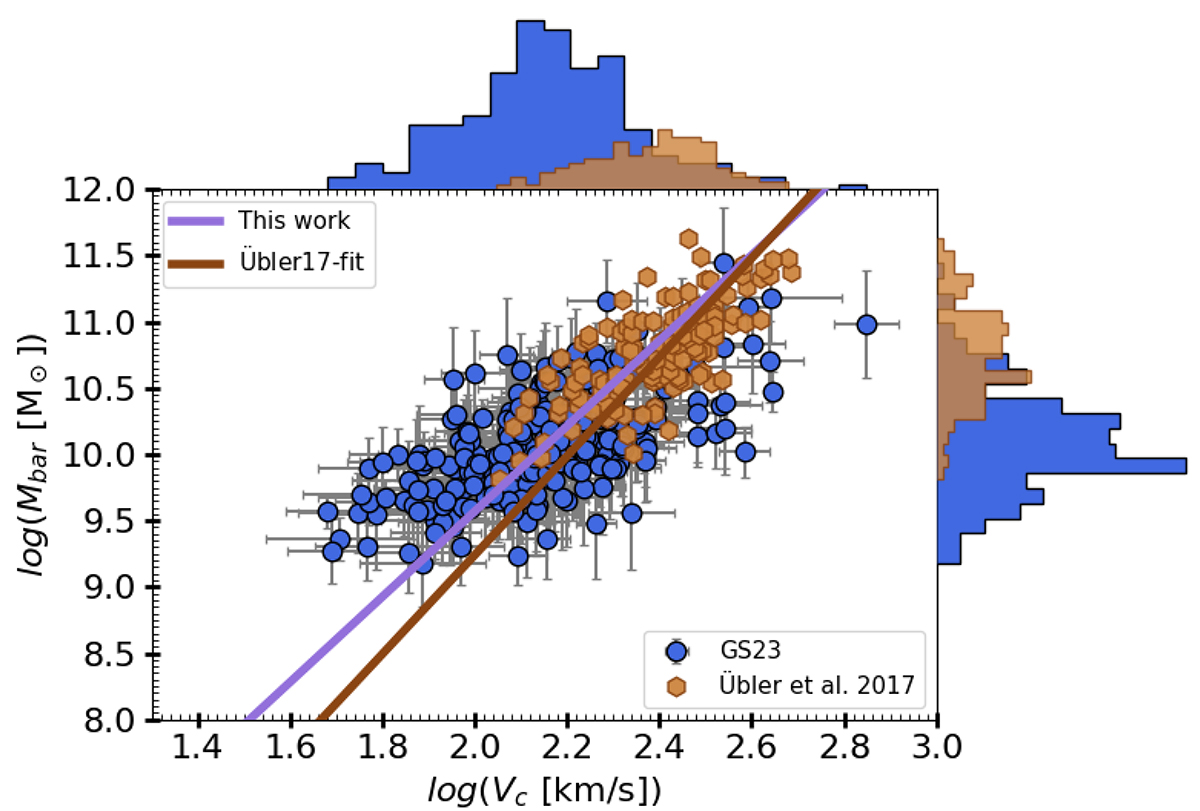
Comparison of BTFR dataset of this study with Übler et al. (2017, brown hexagons). The purple and brown lines represent the best-fit results for our study and Übler et al. (2017), respectively. For a comprehensive comparison of the datasets, we provide histograms showing the distributions of stellar mass and circular velocities, both horizontally and vertically, color-coded according to their respective datasets.
Current usage metrics show cumulative count of Article Views (full-text article views including HTML views, PDF and ePub downloads, according to the available data) and Abstracts Views on Vision4Press platform.
Data correspond to usage on the plateform after 2015. The current usage metrics is available 48-96 hours after online publication and is updated daily on week days.
Initial download of the metrics may take a while.