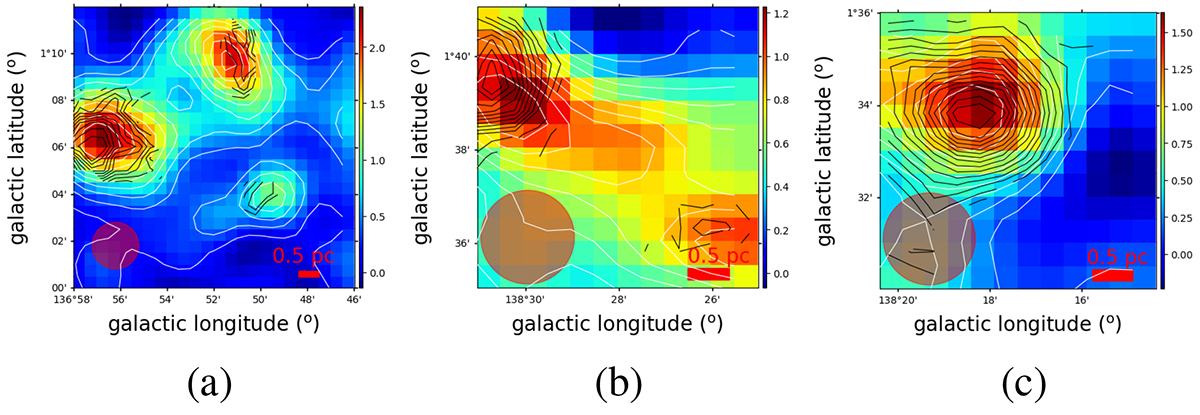
Fig. 9.
Download original image
Color map of the velocity integrated intensities (moment 0) for the C18O line in the regions W5-W1, sh-201 and AFGL 4029. The white and black contours denote the intensity of C18O and NH3(1,1), respectively. The red circles in the lower left and red lines in the lower right of each panel mark the NH3(1,1) beam size (120″) and 0.5 pc length, respectively. (a) W5-W1, (b) sh-201, (c) AFGL4029.
Current usage metrics show cumulative count of Article Views (full-text article views including HTML views, PDF and ePub downloads, according to the available data) and Abstracts Views on Vision4Press platform.
Data correspond to usage on the plateform after 2015. The current usage metrics is available 48-96 hours after online publication and is updated daily on week days.
Initial download of the metrics may take a while.