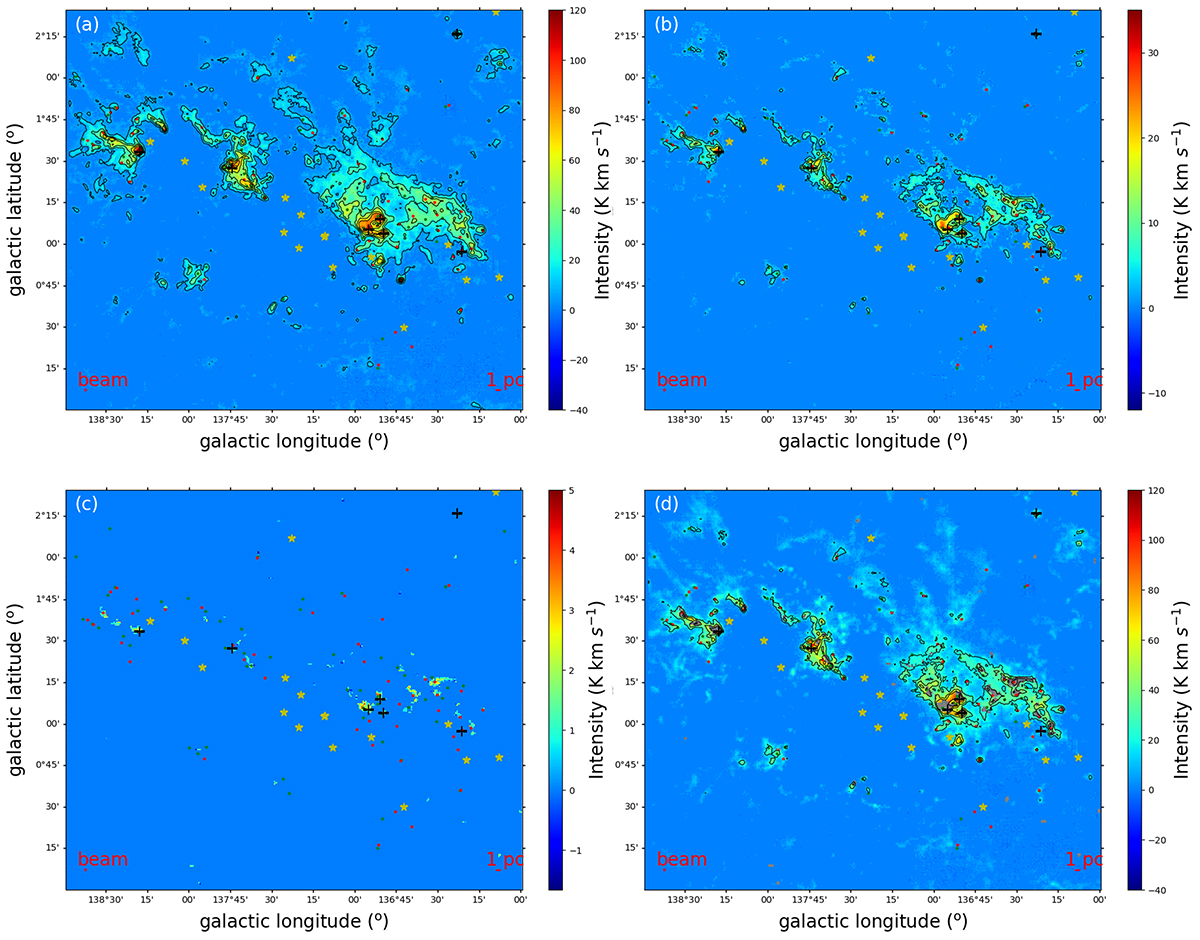
Fig. 2.
Download original image
Moment 0 maps of three CO isotopologues in the W5 region. The integrated local standard of rest velocity range is from VLSR = –50 to –30 km s−1. The first three figures are 12CO, 13CO, and C18O moment 0 maps of integrated intensity. The last one is a comparison of the three isotopologues superimposed, where the background color is the 12CO intensity, the contour line is the 13CO intensity, and the grey areas refer to positions with notable C18O emission. The yellow stars, black crosses, and small green and red dots in each map mark OB stars, HMYSOs (Lumsden et al. 2013), and blue and red lobes identified as CO outflows by Li et al. (2019), respectively.
Current usage metrics show cumulative count of Article Views (full-text article views including HTML views, PDF and ePub downloads, according to the available data) and Abstracts Views on Vision4Press platform.
Data correspond to usage on the plateform after 2015. The current usage metrics is available 48-96 hours after online publication and is updated daily on week days.
Initial download of the metrics may take a while.