Fig. 19.
Download original image
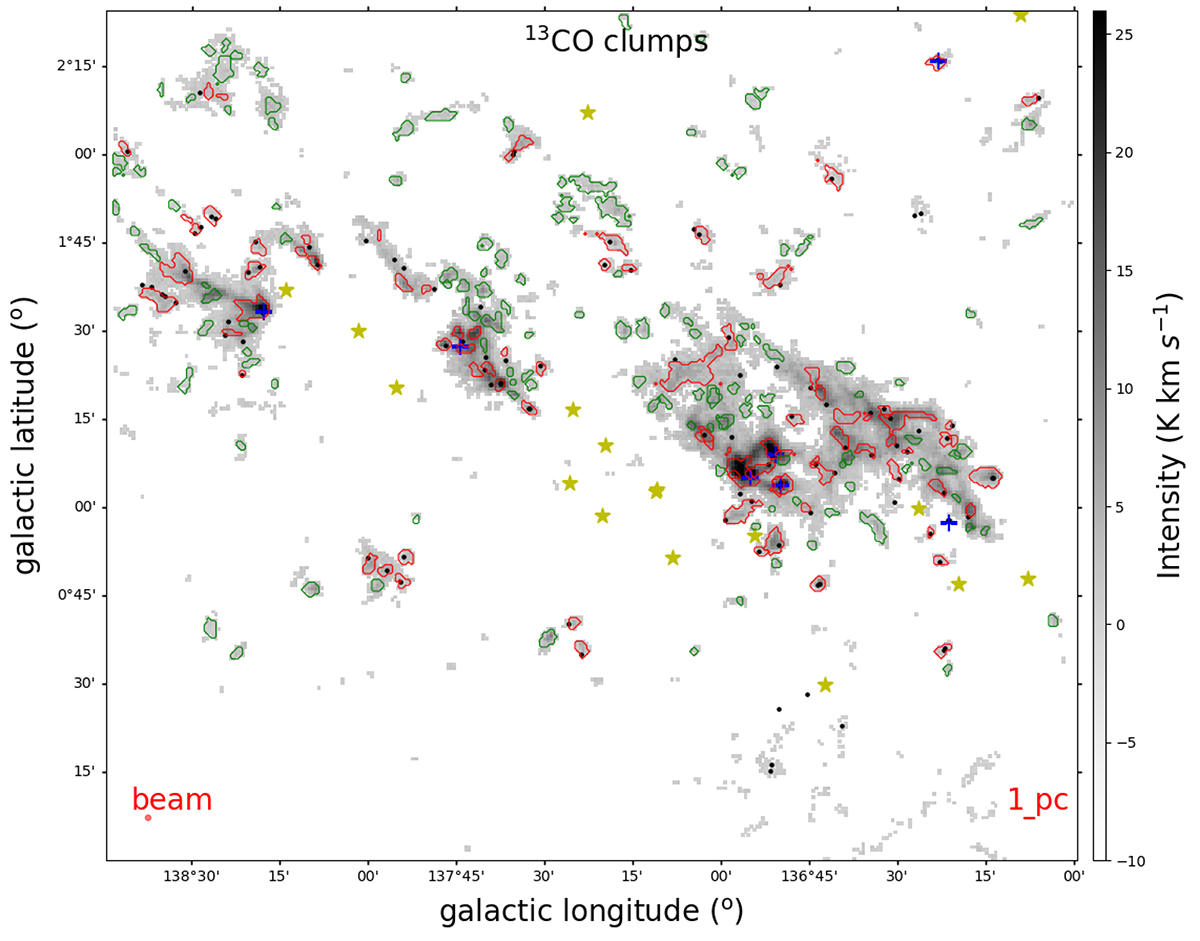
Distribution of “outflow clumps” and “non-outflow clumps” classified according to whether there is an outflow (Li et al. 2019) inside a given clump. Red contours denote 13CO-identified clumps that are classified as “outflow clumps,” while green contours show all other 13CO-identified clumps as “non-outflow clumps.” The gray background image, yellow stars and blue crosses are the same as in Fig. 15. The small black dots correspond to CO outflows identified by Li et al. (2019).
Current usage metrics show cumulative count of Article Views (full-text article views including HTML views, PDF and ePub downloads, according to the available data) and Abstracts Views on Vision4Press platform.
Data correspond to usage on the plateform after 2015. The current usage metrics is available 48-96 hours after online publication and is updated daily on week days.
Initial download of the metrics may take a while.