Open Access
Fig. 17.
Download original image
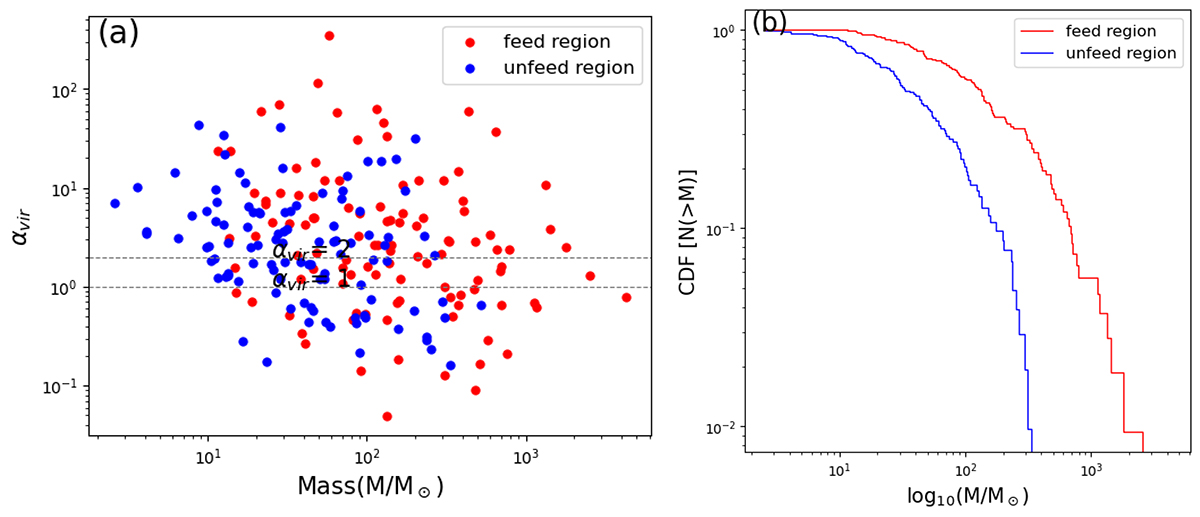
(a) Virial parameter (α) vs. mass for the clumps in the feedback (red dots) and non-feedback (blue dots) regions. The black dashed lines are the same as in Fig. 14. (b) Cumulative distribution function (CDF) of mass between feedback (red line) and non-feedback region (blue line).
Current usage metrics show cumulative count of Article Views (full-text article views including HTML views, PDF and ePub downloads, according to the available data) and Abstracts Views on Vision4Press platform.
Data correspond to usage on the plateform after 2015. The current usage metrics is available 48-96 hours after online publication and is updated daily on week days.
Initial download of the metrics may take a while.