Fig. 14.
Download original image
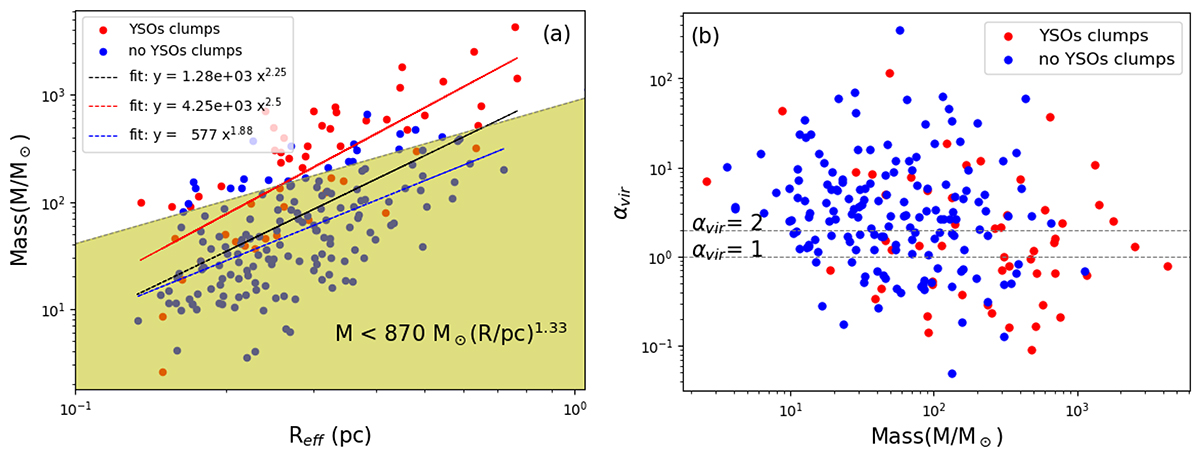
(a) Mass and radius relationships for all identified 13CO clumps. The red and blue dots correspond to clumps that respectively contain and do not contain class I YSOs. The distribution of YSOs is illustrated in Fig. 11. The black, red, and blue dashed lines represent the best power-law fits for the mass-radius relationship for all clumps, YSOs clumps, and no YSOs clumps, respectively. The yellow area denotes the empirically derived parameter set m(r) < 870 M⊙(r/pc)1.33, where massive star formation should not occur (Kauffmann & Pillai 2010). (b) Virial mass relationships for all 13CO clumps, The black dashed lines correspond to positions with virial values of 1 and 2. Values below unity represent the gravitationally bound state and values above two indicate a gravitationally unbound state, respectively (see also Eq. (17)).
Current usage metrics show cumulative count of Article Views (full-text article views including HTML views, PDF and ePub downloads, according to the available data) and Abstracts Views on Vision4Press platform.
Data correspond to usage on the plateform after 2015. The current usage metrics is available 48-96 hours after online publication and is updated daily on week days.
Initial download of the metrics may take a while.