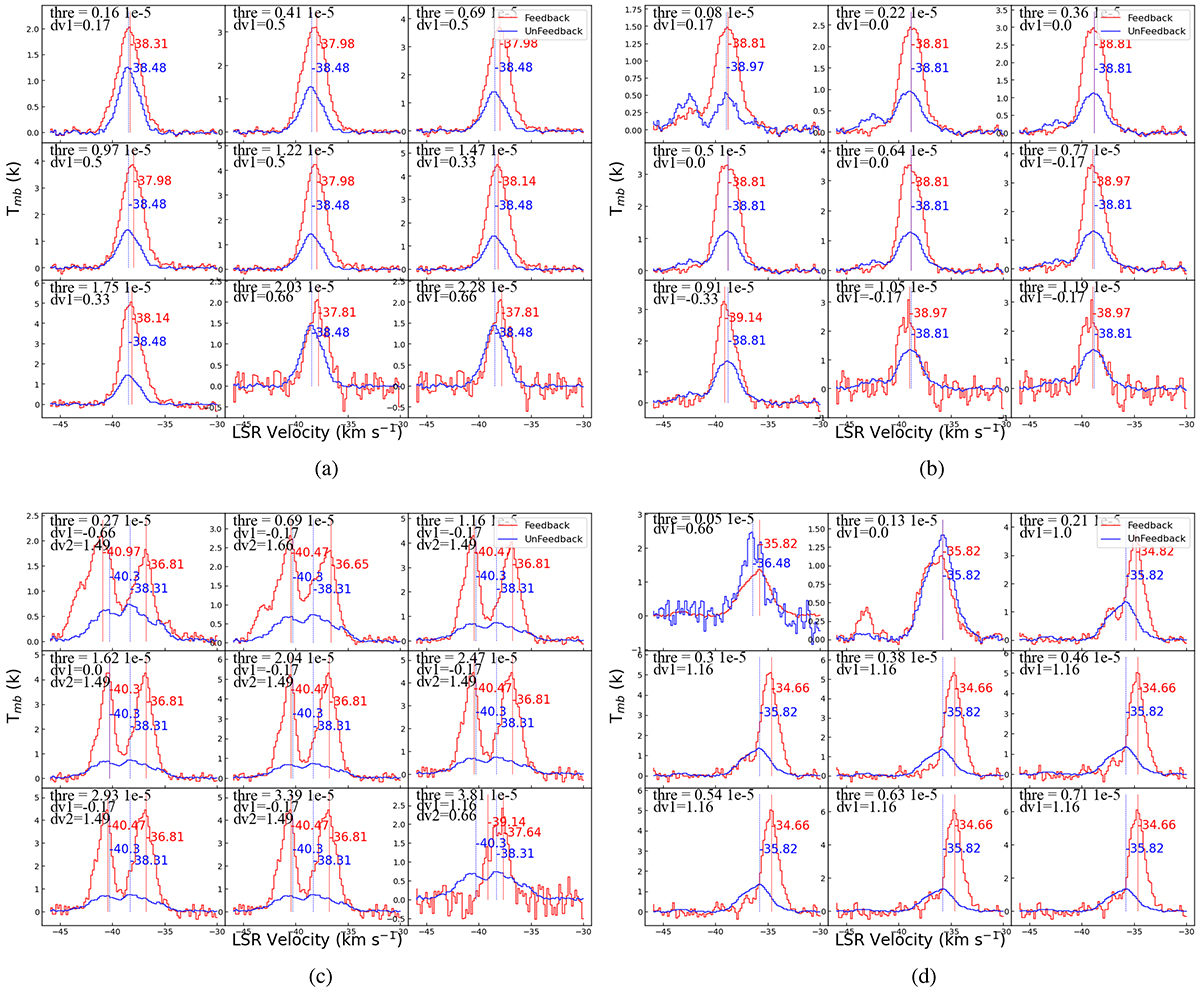
Fig. 13.
Download original image
Stacked spectra of 13CO (J = 1–0) emission corresponding to the “inside” (red) and “outside feedback” zones (blue) for different choices of MSX at 8.28 μm flux density (designated as “thre” in units of W/(m−2⋅ sr) in the top–left of each subplot) in the four regions: W5-E1, W5-M, W5-W1, and W5-W2, as described in Fig. 8. The red solid and blue dotted lines in all the subplots correspond to the position of peak emission of the average stacked spectra inside and outside the feedback zone with MSX 8.28 μm flux densities above and below the variation threshold. The velocity interval between the two peak lines is expressed in “ dv” ( km s−1) on the top–left of each subplot. (a) W5-E1, (b) W5-M, (c) W5-W1, (d) W5-W2.
Current usage metrics show cumulative count of Article Views (full-text article views including HTML views, PDF and ePub downloads, according to the available data) and Abstracts Views on Vision4Press platform.
Data correspond to usage on the plateform after 2015. The current usage metrics is available 48-96 hours after online publication and is updated daily on week days.
Initial download of the metrics may take a while.