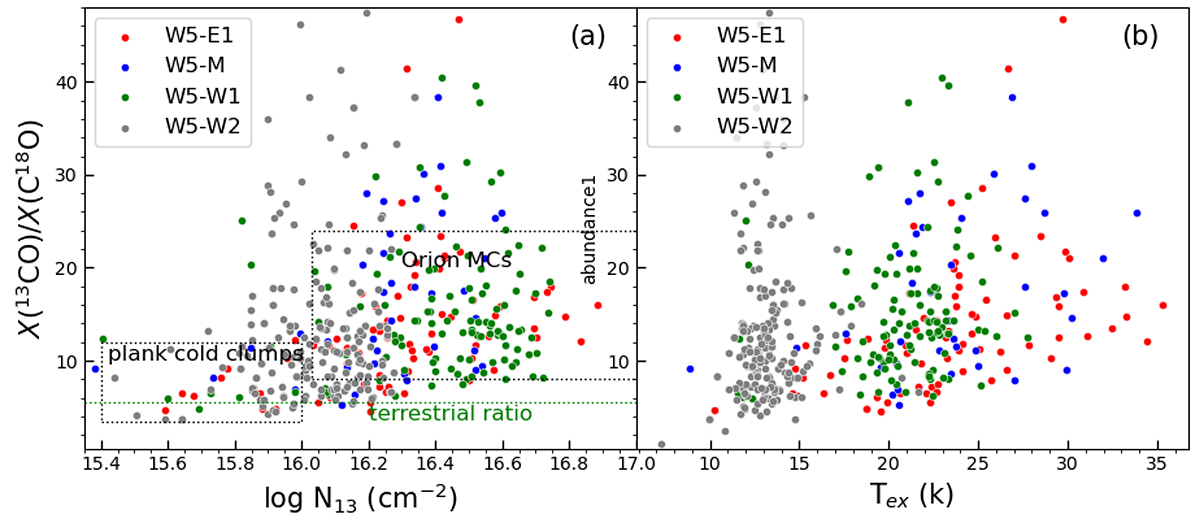
Fig. 12.
Download original image
(a) Relation between X(13CO)/X(C18O) and N(13CO). The red, blue, green, and gray dots correspond to pixels in the W5-E1, W5-M, W5-W1 and W5-W2 regions, respectively. The gray dashed rectangles delineate the principal distribution areas within the Planck cold clumps (Wu et al. 2012), and the Orion molecular clouds (Shimajiri et al. 2014), corresponding to type I and typeII molecular clouds (Wang et al. 2019), respectively. The green line indicates the terrestrial ratio X(13CO)/X(C18O) = 5.5 (Wilson & Matteucci 1992). (b) Relation between X(13CO)/X(C18O) and Tex. Note that only those pixels with both detectable (larger than 3σ) 13CO and C18O emissions are plotted.
Current usage metrics show cumulative count of Article Views (full-text article views including HTML views, PDF and ePub downloads, according to the available data) and Abstracts Views on Vision4Press platform.
Data correspond to usage on the plateform after 2015. The current usage metrics is available 48-96 hours after online publication and is updated daily on week days.
Initial download of the metrics may take a while.