Open Access
Fig. 11.
Download original image
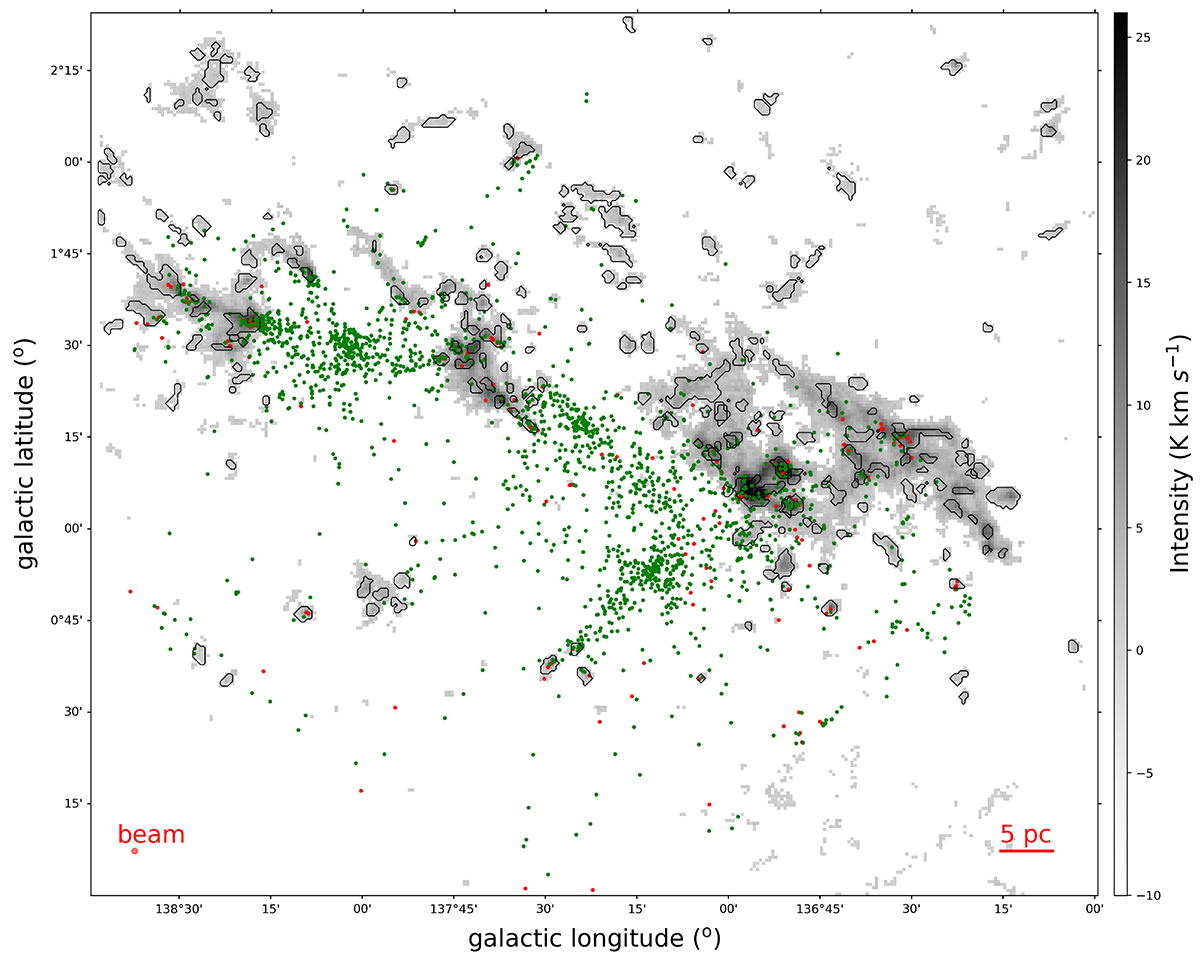
Identified clumps (leaves) in 13CO cube data. Clumps are marked by a black contour line in the figure. The grey intensity map is a moment 0 map of 13CO in the LSR-velocity range –50 to –30 km s−1. The red and green dots represent the class I and class II Young Stellar Objects (YSOs) classified by Koenig et al. (2008).
Current usage metrics show cumulative count of Article Views (full-text article views including HTML views, PDF and ePub downloads, according to the available data) and Abstracts Views on Vision4Press platform.
Data correspond to usage on the plateform after 2015. The current usage metrics is available 48-96 hours after online publication and is updated daily on week days.
Initial download of the metrics may take a while.