Open Access
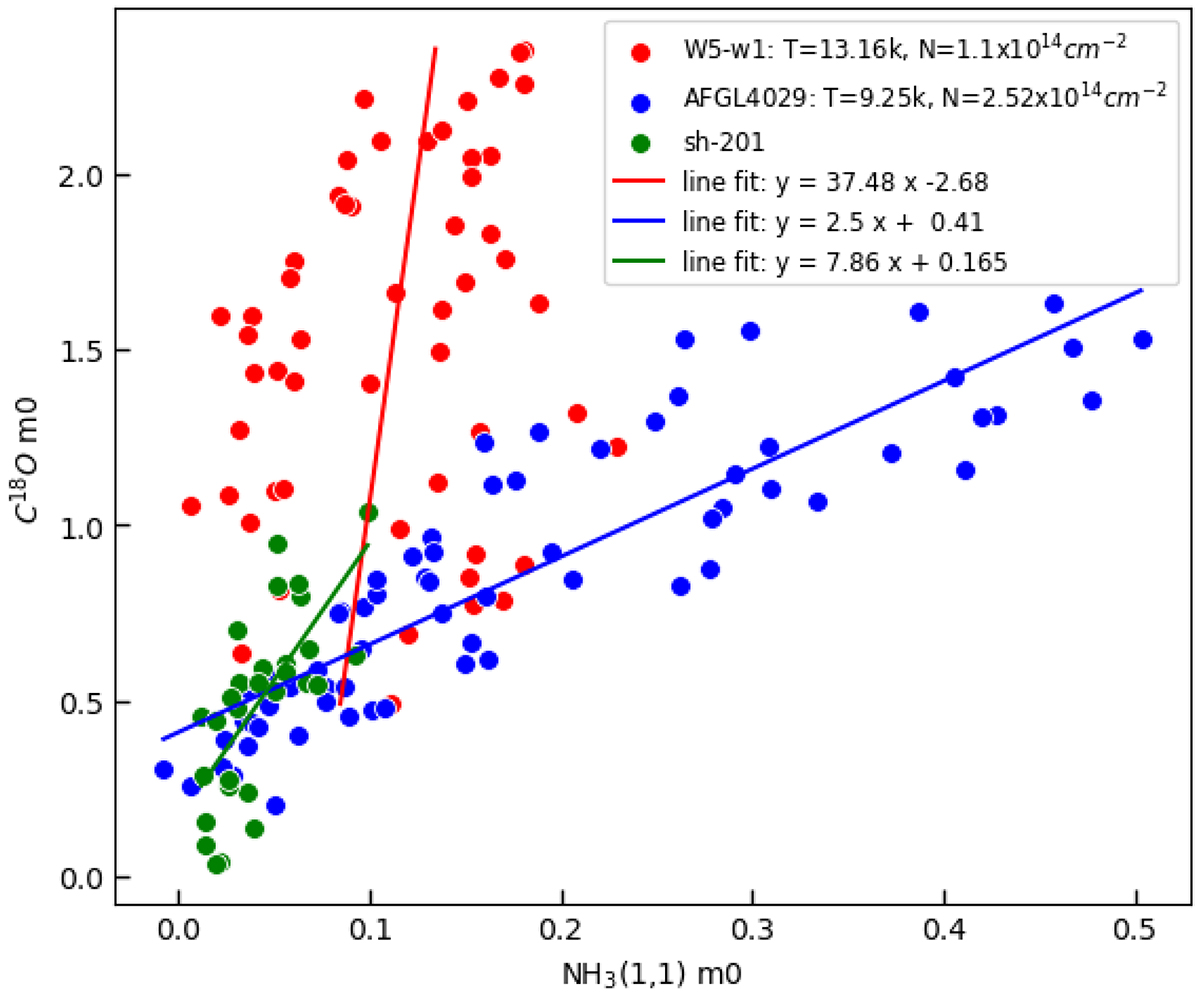
Fig. 10.
Download original image
The point-to-point intensity distribution of NH3(1,1) and C18O in the three regions of Fig. 9. The red, blue, and green dots correspond to the areas W5-W1, AFGL 4029, and sh-201, respectively. The red, blue, and green lines are linear fits to the three types of scatters.
Current usage metrics show cumulative count of Article Views (full-text article views including HTML views, PDF and ePub downloads, according to the available data) and Abstracts Views on Vision4Press platform.
Data correspond to usage on the plateform after 2015. The current usage metrics is available 48-96 hours after online publication and is updated daily on week days.
Initial download of the metrics may take a while.