Fig. 1.
Download original image
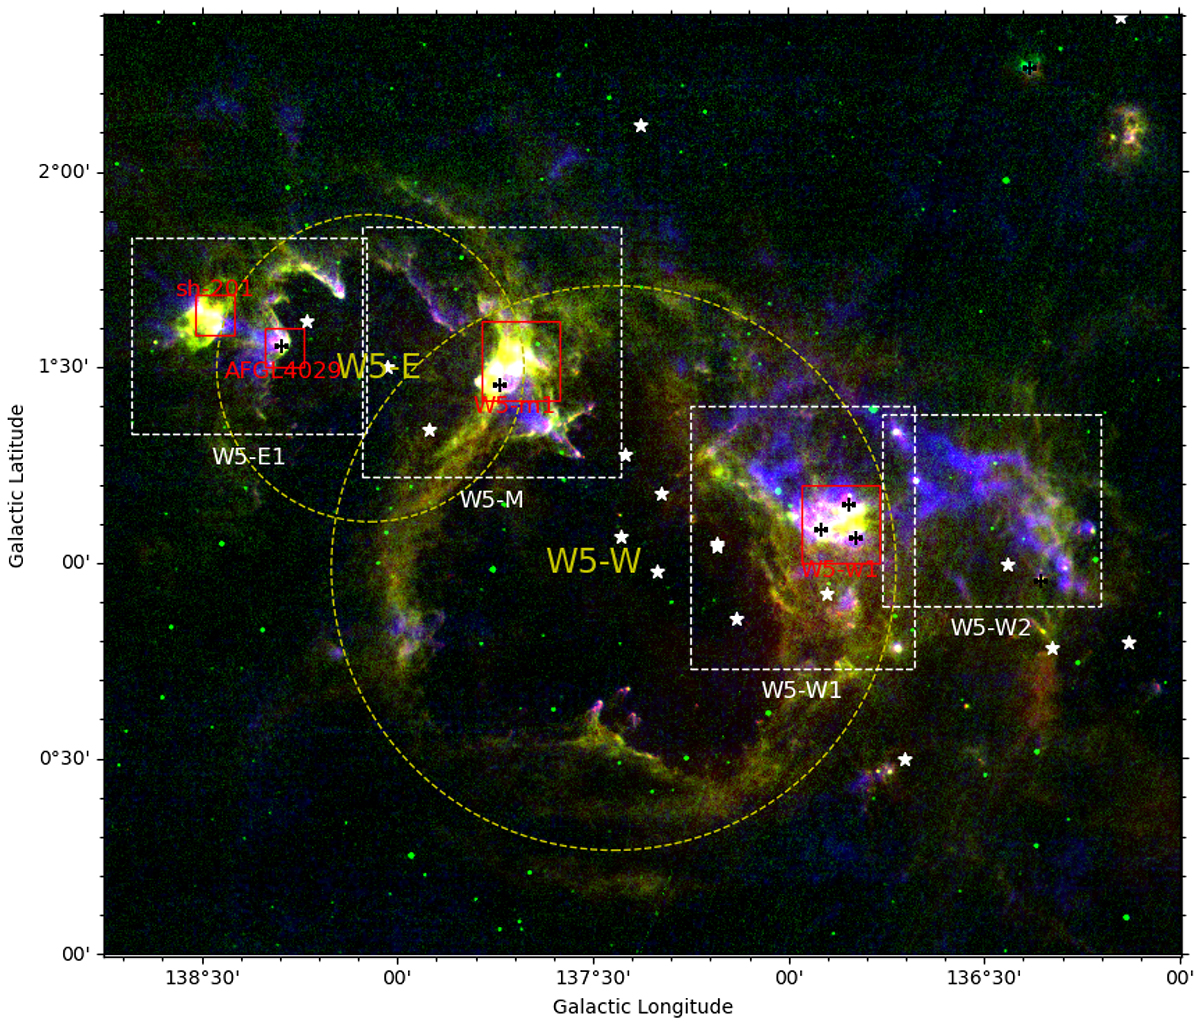
RGB image (red: Herschel-PACS at 250 μm, green: MSX at 8.28 μm, blue: PMO 13CO(1–0) in the integrated local standard of rest velocity range from –63 to –28 km s−1) of the W5 star-forming complex. The 250 μm emission is dominated by warm dust heated by absorbed starlight. The interface between the ionized and molecular gas appears as a blend of green (strong 8 μm emission from PAHs), and blue (representing the colder CO molecular gas). The entire area displayed by the figure has been mapped in three CO J = 1–0 isotopologues (see Sect. 3.1). The red boxes represent the areas in which NH3 has been observed. The two yellow dotted circles represent the boundaries of the two bubbles, W5-E and W5-W. The definition of the boundary was taken from a catalog of HII regions (Anderson et al. 2014) based on all-sky Wide-Field Infrared Survey Explorer (WISE) data. Four white dotted boxes mark the extent of the four areas studied in this article (W5-E1, W5-M, W5-W1, and W5-W2). White stars and black plus signs indicate identified OB stars (Roman-Lopes et al. 2019) and high-mass young stellar objects (HMYSOs) (Lumsden et al. 2013), respectively. Due to the specific location of W5, the galactic longitude and latitude axes are to first order roughly parallel to right ascension and declination (RA and Dec).
Current usage metrics show cumulative count of Article Views (full-text article views including HTML views, PDF and ePub downloads, according to the available data) and Abstracts Views on Vision4Press platform.
Data correspond to usage on the plateform after 2015. The current usage metrics is available 48-96 hours after online publication and is updated daily on week days.
Initial download of the metrics may take a while.