Fig. 4
Download original image
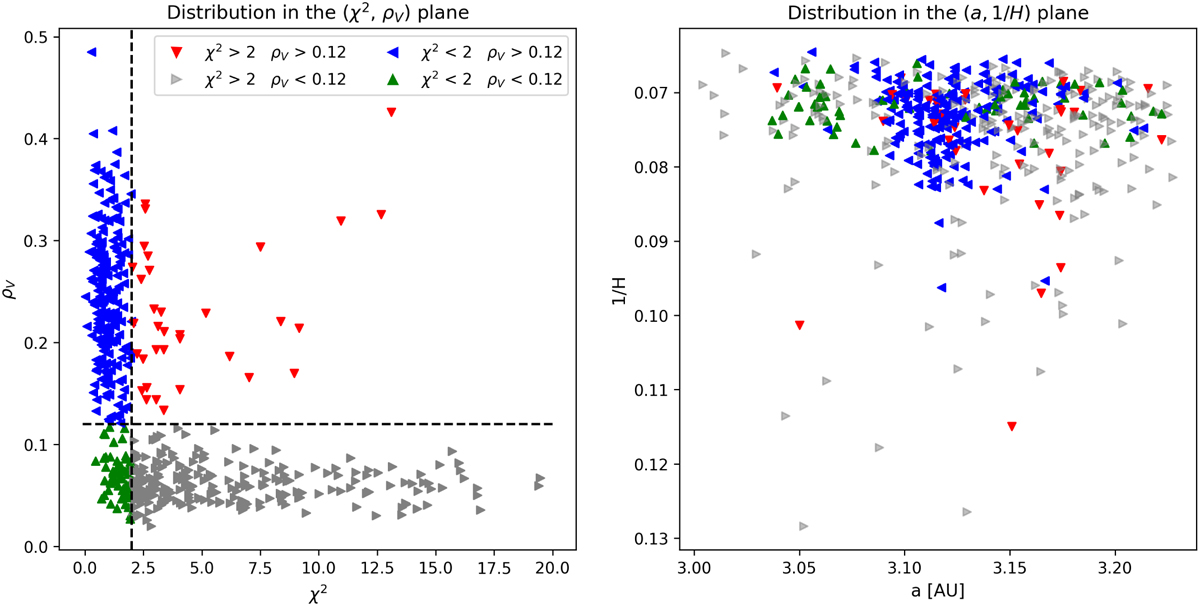
χ2 distribution of the objects observed by Gaia within the Tirela/Klumpkea region. Left panel: distribution in the (χ2, ρV) plane. Red points have ρV > 0.12 and χ2 > 2, blue points have ρV > 0.12 and χ2 < 2, green points have ρV < 0.12 and χ2 < 2 and finally grey points have ρV < 0.12 and χ2 > 2. Right panel: distribution in the (a, 1/H) plane of the points reported in the left panel.
Current usage metrics show cumulative count of Article Views (full-text article views including HTML views, PDF and ePub downloads, according to the available data) and Abstracts Views on Vision4Press platform.
Data correspond to usage on the plateform after 2015. The current usage metrics is available 48-96 hours after online publication and is updated daily on week days.
Initial download of the metrics may take a while.